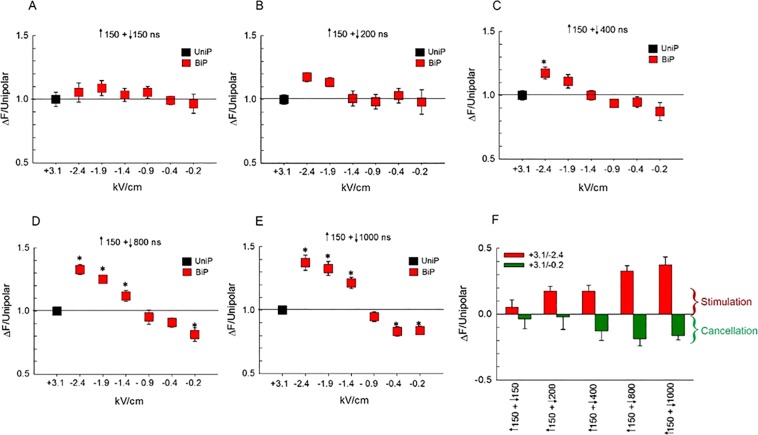
Figure 7.
Effect of simultaneously decreasing the amplitude and increasing the duration of the negative phase of a bipolar pulse on [Ca2+]i. For panels (A–E), the amplitude of Ca2+ transients (mean ± s.e.m.) triggered by bipolar pulses was normalized to that elicited by a 150 ns unipolar pulse (n = 6–9) set to an E-field of 3.1 kV/cm, and plotted as a function of the E-field amplitude of the negative pulse (represented as negative values). Pulse duration combinations were as follows: (A) ↑150 + ↓150 ns (n = 7–9), (B) ↑150 + ↓200 ns (n = 5–9), (C) ↑150 + ↓400 ns (n = 6–11), (D) ↑150 + ↓800 ns (n = 10–16) and (E) ↑150 + ↓1000 ns (n = 7–12). (F) Bar graph showing the mean ± s.e.m. for the maximal increase (Stimulation) or decrease (Cancellation) in the amplitude of the Ca2+ transients for the responses shown in (A–E) relative to that elicited by a 150 ns unipolar pulse. The E-field of the negative phase of the pulse was either 2.4 or 0.2 kV/cm. *p < 0.05, significantly different from corresponding 150 ns unipolar pulse.

