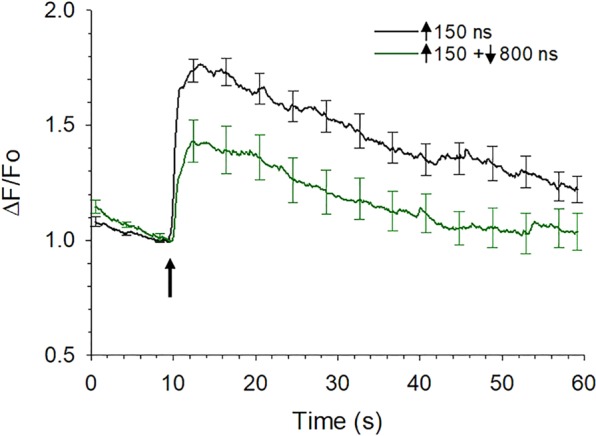
Figure 8.

Comparison of the effect of asymmetrical bipolar pulses vs a unipolar pulse on [Ca2+]i when the duration of the negative phase was increased and the amplitude decreased. Averaged cell responses ± s.e.m for cells exposed to a 150 ns unipolar pulse vs a ↑150 + ↓800 ns pulse (n = 15–10) in which the positive pulse phase was set to 3.1 kV/cm and negative pulse phase set at 0.2 kV/cm. The arrow indicates when the pulse was delivered to the cells.
