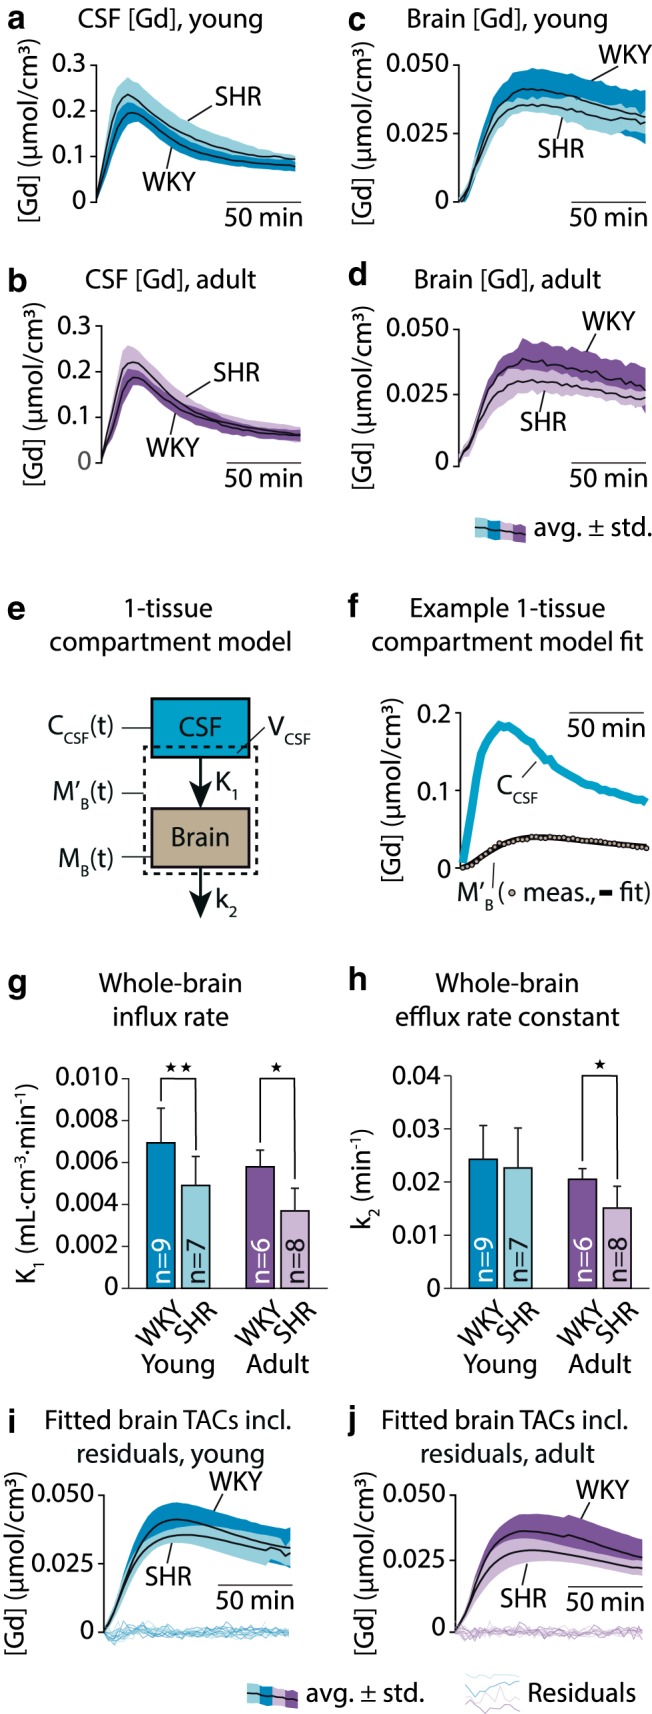
Figure 4.

Average TCCs of Gd-DOTA showed occasionally slightly higher CSF Gd-DOTA concentration in the CSF of young (a) and adult (b) hypertensive rats and their normotensive controls. Average TCCs of Gd-DOTA in the brain compartment of young SHR and WKY (c) and adult SHR and WKY (d). Average TCCs are shown as mean ± SD. e, Schematic overview of the one-tissue compartment model applied to brain and CSF TCCs to calculate the glymphatic influx rate (K1) and efflux rate constant (k2). f, Example of the one-tissue compartment model fit. The calculated K1 was significantly lower in the SHR than in WKY in both age groups (g), and k2 was lower in the adult, but not the young, SHR compared with their age-matched controls (h). Average modeled time-activity curves and residuals from the young (i) and adult (j) age groups. *p < 0.05, **p < 0.01.
