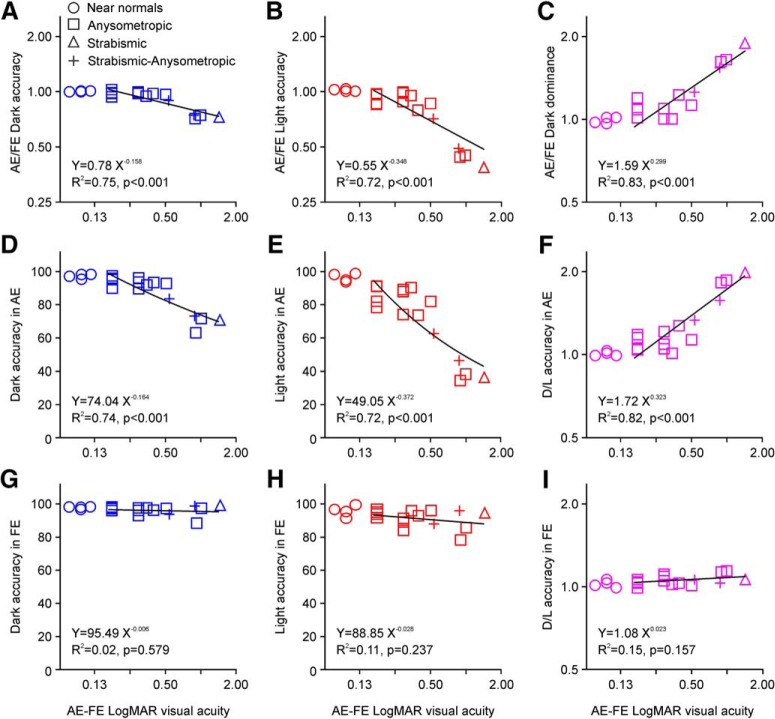
Figure 4.
Dark dominance of visual salience is correlated with the severity of amblyopia. A, Ratio between amblyopic and fellow eyes for dark-target accuracy (blue) is correlated with severity of amblyopia [estimated from the difference in best-corrected visual acuity between amblyopic (AE) and fellow eye (FE)]. The plot shows the data from near normal observers (circles; AE: eye with lowest visual acuity), AA (squares), SA (triangle), and SAA (crosses). The line shows a power regression function fit to the data for amblyopes (equations, goodness of fit and significance shown at the bottom). B, Same as A for light-target accuracy (red). C, Same as A for dark dominance (ratio between dark accuracy and light accuracy). D, Same as A for dark-target accuracy with the amblyopic eye. E, Same as A for light-target accuracy with the amblyopic eye. F, Same as A for dark dominance with the amblyopic eye. G–I, Same as D–F for the FE.

