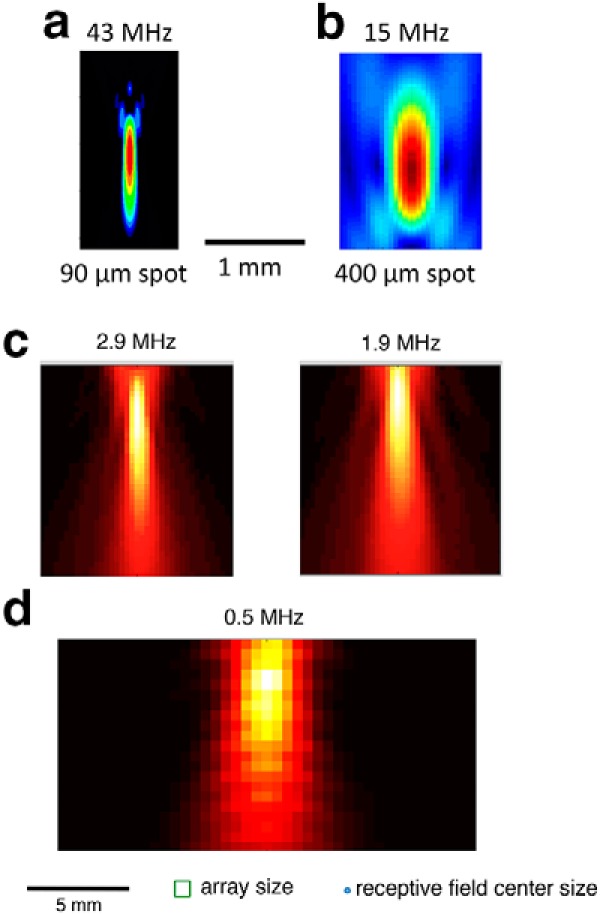
Figure 2.

Spatial distribution of intensity for different transducers and carrier frequencies. a, X-Z plot of intensity for 43 MHz transducer, having a 90 μm lateral and 1330 μm longitudinal focal volume (−3 dB). b, 15 MHz transducer. Scale bar: a, b, 1 mm. c, A 2.25 MHz transducer was operated at two different frequencies. Left, 2.9 MHz. Right, 1.9 MHz. d, 0.5 MHz transducer. Scale bar: c, d, 5 mm. Bottom, Array size and typical ganglion cell receptive field center size.
