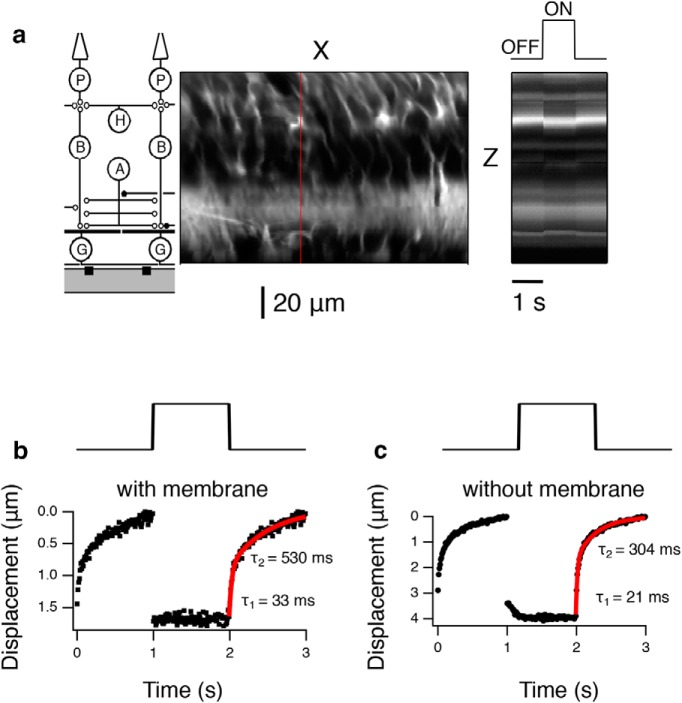
Figure 4.
Dynamics of ultrasonic displacement in the retina at 43 MHz (ISP = 40 W/cm2). a, Left, Schematic of the retinal circuit aligned vertically with images to the right. Middle, X-Z image slice. Red line indicates the spatial cross section, which is then shown as a function of time at right. Right, Temporal changes during 1 s ultrasound OFF, 1 s ON, and 1 s OFF. b, Maximum downward displacement with the dialysis membrane in place. A Gaussian was fit to the bright spot in each 10 ms time bin, and the mean position plotted as a function of time. Top, Stimulus trace showing the timing of ultrasound onset and offset. Bottom, Vertical displacement as a function of time. The relaxation after stimulus offset is shown fit with a double exponential (red curve). c, Maximum downward displacement without the dialysis membrane in the pathway.

