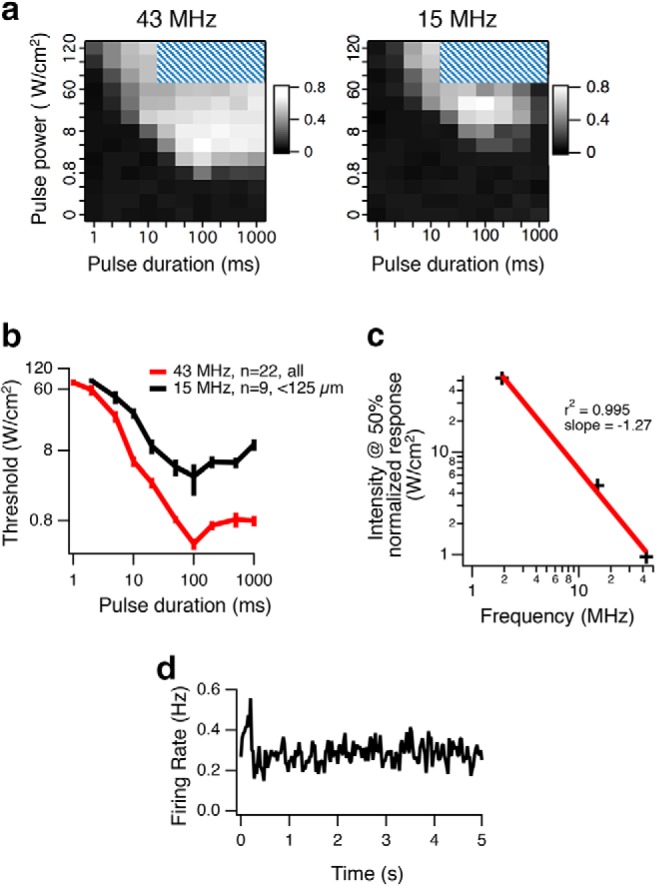
Figure 6.

Ultrasonic stimulation at higher acoustic frequency has a lower threshold. a, Left, Normalized population (n = 22) firing rate is plotted as a function of intensity ISP and pulse duration for 43 MHz. Cross-hatching indicates parameters not tested. Right, Same plot for 15 MHz for cells <125 μm from the focus (n = 9). b, Threshold of stimulation as a function of pulse duration. Average thresholds across cells (error bars indicate SEM) at each pulse duration for 43 and 15 MHz. c, In separate experiments, normalized population responses were measured for three carrier frequencies (43, 15, and 1.9 MHz; see Fig. 7c). The half-maximal intensity is plotted against carrier frequency (black +). Red linear regression line has a slope of −1.27, indicating that the exponent on frequency dependence is 1.27; this compares with a value of 1.18 (Goss et al., 1979) that was used in the radiation force models of Figure 7. d, The population peristimulus time histogram (n = 75) generates a very weak response to ultrasound (100 ms ON starting at time 0, repeated every 5 s) for a 500 kHz transducer at ISP = 1.6 W/cm2.
