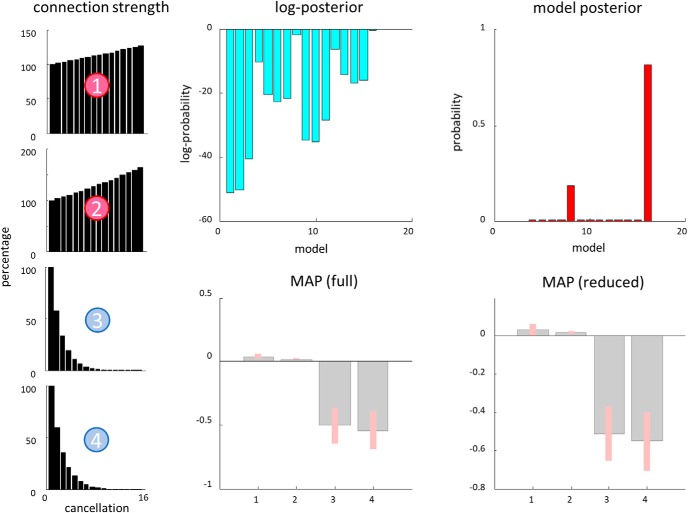
Figure 8.
Time-dependency of modulatory changes. The plots on the right are the same as those in Figure 6, but modeling a parametric effect of number of previous cancellations. For this model, in place of the early and late conditions, we treated each sequential cancellation as a separate event. Because the model is parameterized in terms of log-scaling parameters, linear (i.e., [0,1,…,15]) parametric effects of time (number of previous cancellations) correspond to a monoexponential change in coupling [starting from a strength of exp(0), corresponding to 100%]. The two most probable models are the same as in Figure 6, and the overall pattern of changes shown in the MAP estimates is the same (but with some evidence in favor of a small change in Connection 1). The plots on the left show the estimated changes in each connection with successive cancellation events, as a percentage of their initial values. These indicate an increase in the strength of forward excitatory connections over time, and a decrease in backward inhibitory connections.

