Figure 1.
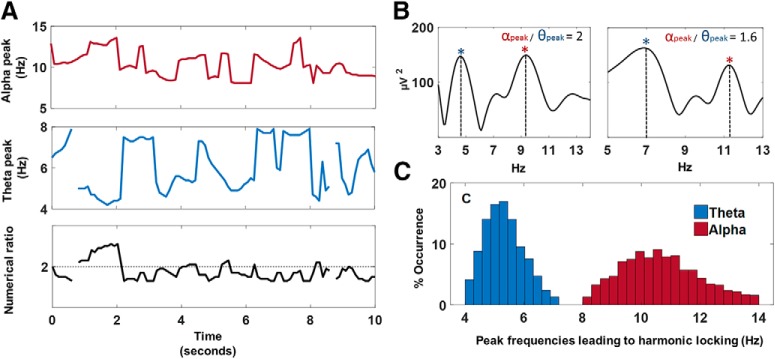
Transient detection of alpha/theta peak frequencies and determination of cross-frequency relationships. Transient peak frequencies of the theta (4–8 Hz) and alpha (8–14 Hz) bands were detected within 1 s epochs and the numerical ratio between the alpha and theta peak frequencies was calculated (peak-frequencyalpha/peak-frequencytheta). A, Visualizes the transient (epoch-wise) variability of alpha and theta peak frequencies over time (i.e., 10 s) for an exemplary subject and electrode, as well as the transient numerical ratio over time. B, Visualizes the frequency spectra of two exemplary epochs in which the identified alpha and theta peak frequencies (indicated by asterisks) formed a harmonic (2:1) versus a nonharmonic (1.6:1) cross-frequency relationship. C, Visualizes the distribution of alpha and theta peak frequencies that yielded harmonic 2:1 cross-frequency relationships (across experiments, conditions, subjects, and electrodes).

