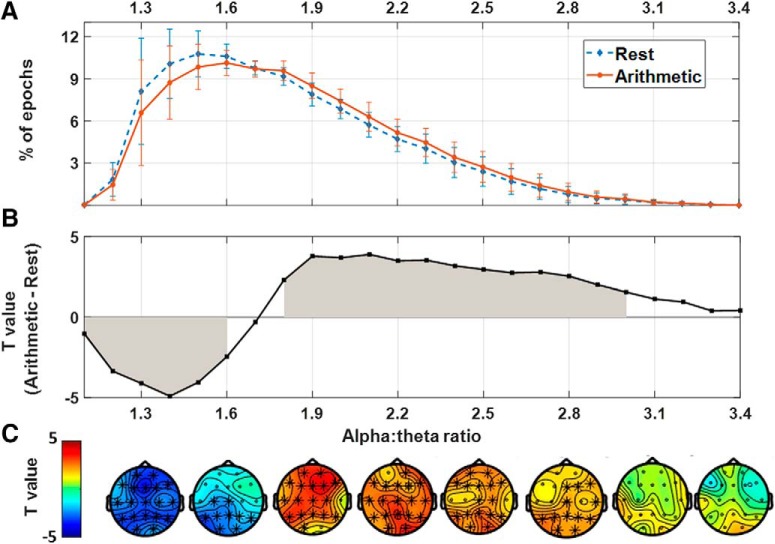
Figure 4.
Assessment of condition-related differences for all possible alpha–theta cross-frequency relationships (i.e., ratios within a range of 1.1–3.4). A, Visualizes the occurrence of each cross-frequency relationship (proportion of epochs, averaged across electrodes), separately for arithmetic and rest conditions (error bars indicate SD across subjects). B, Visualizes condition-related differences (between arithmetic, and rest, averaged across electrodes) in the proportion of each ratio by plotting the respective paired samples t test values (i.e., higher t values indicate a higher incidence of a ratio in the arithmetic vs the rest condition) averaged across electrodes. A positive cluster of cross-frequency ratios ranging between 1.8 and 3.0 was identified, indicating an increased occurrence of these ratios during the arithmetic compared with the rest condition (gray area). In addition, a negative cluster was identified within a range of cross-frequency ratios between 1.1 and 1.6, indicating a lower occurrence of these ratios during the arithmetic compared with the rest condition (gray area). The topographical heat maps in C visualize the spatial distribution of these clusters.

