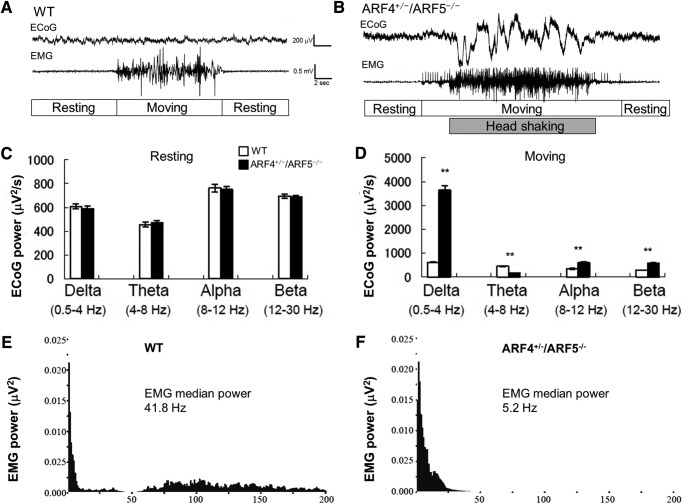
Figure 3.
Abnormal ECoG and EMG activities in ARF4+/−/ARF5−/− mice upon moving periods. A, B, Representative ECoG and EMG traces in WT (A) or ARF4+/−/ARF5−/− (B) mice upon wakefulness. C, D, ECoG power spectrums were quantified in non-moving, resting mice (C) and moving (D) mice upon wakefulness. **p < 0.001, Student's t test (WT vs ARF4+/−/ARF5−/−, n = 6 each, t test). E, F, A representative EMG power spectrum was calculated in moving WT (E) or ARF4+/−/ARF5−/− (F) mouse upon wakefulness.

