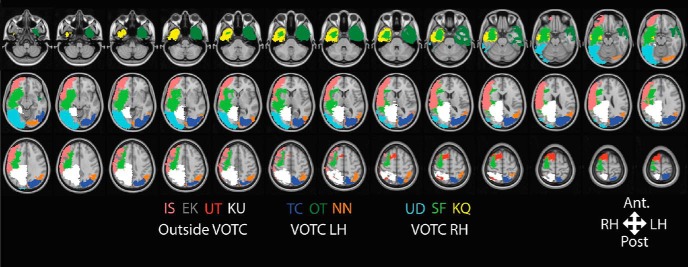
Figure 2.
Overlay map constructed from the lesions of all 10 patients. Each color denotes the extent of the resection in a single patient (code for each patient is at the bottom of the figure; Table 1). The resections were hand-drawn in native space for each patient and transformed to MNI space for visualization purposes only.

