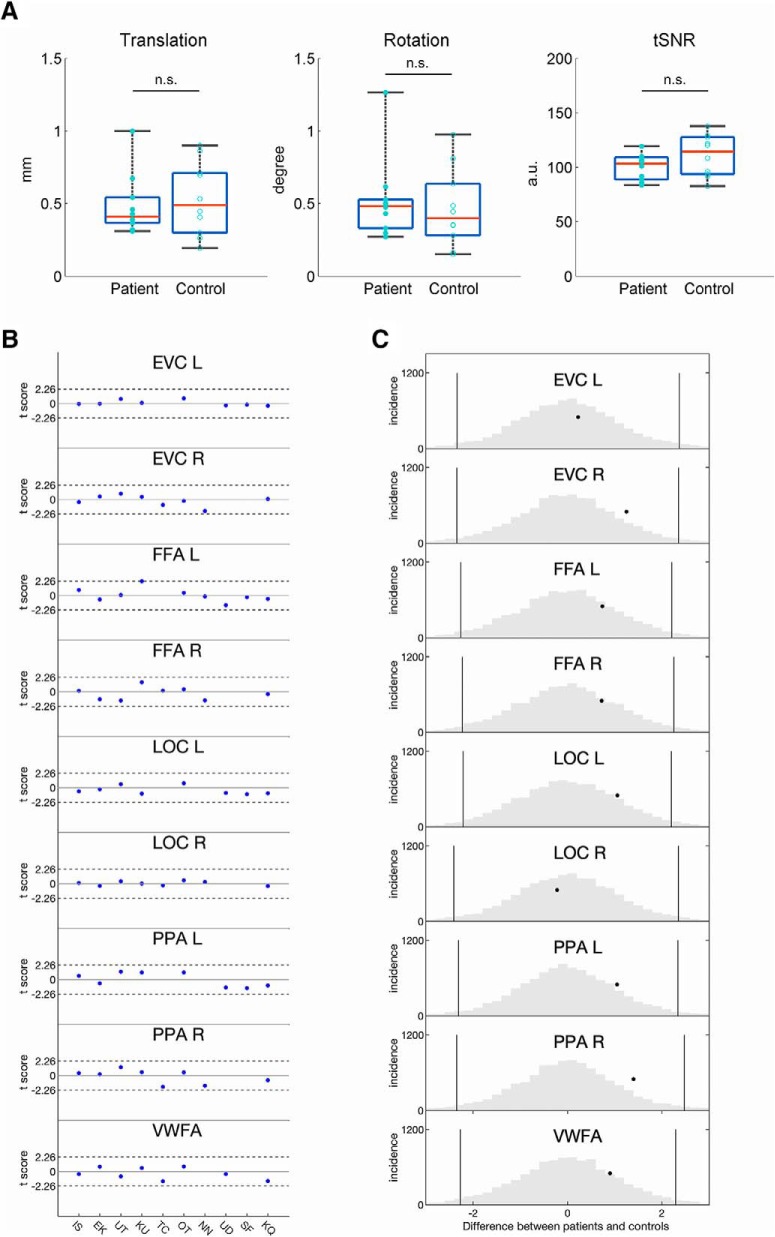
Figure 6.
The quality of the scan and the magnitude of category-selective responses in patients and controls. A, Quality of the scan: the amount of translation (in millimeters), rotation (in degrees), and tSNR (in arbitrary units) did not differ significantly between patients and controls. Boxplot represents the median (red line), the 25 and 75% quartiles (length of the blue box), the minimum and maximum values (black whiskers), and the value for each participant (patient, solid circle; control, empty circle). B, Single-case comparisons: Crawford's t tests show that the magnitude of category-selectivity and EVC activation in each patient was within the control range. C, Group-level analyses: a permutation approach compares the t score of difference in the magnitude of selectivity between the VOTC patients and their matched controls (black dot) against the null distribution of the between-group t scores (gray histogram). n.s. = not significant.

