
Figure 1.
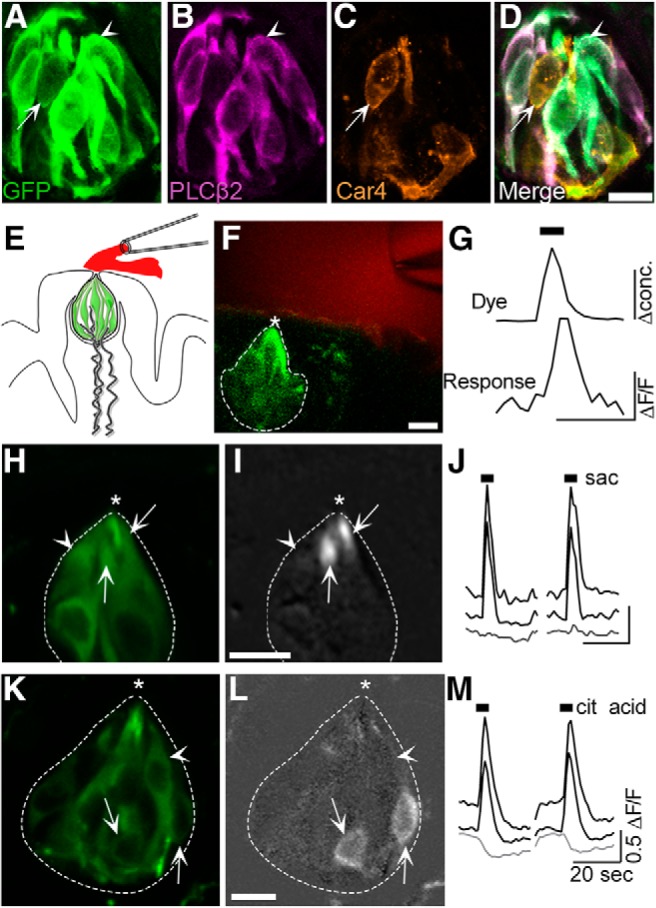
Type 2 and Type 3 fungiform taste bud cells in lingual slices respond to focal taste stimulation. A–D, GCaMP3 is selectively expressed in Type 2 and Type 3 taste bud cells. Cryosection of a fungiform papilla from a Pirt-GCaMP3 mouse, immunostained with anti-GFP to mark GCaMP3+ taste bud cells (A, green). Anti-PLCβ2 (B, magenta) to display Type 2 taste cells and anti-Car4 (C, orange) to visualize Type 3 taste cells. D, The merged image shows co-expression of GCaMP with PLCβ2+ (arrowhead) and Car4+ (arrow) cells. E, Diagram of a fungiform taste bud (green cells) in a lingual slice with focal taste stimulation tracked with a fluorescent dye (red). F, Micrograph showing living lingual slice, imaged for GCaMP (green), where the taste pore (*) is focally stimulated with a tastant (including a tracking dye, red). Dashed lines outline the taste bud. G, Focally applied taste stimuli at the taste pore (top) display rapid onset and washout (calibration bars, 2-fold change in concentration, top; 0.25 ΔF/F, bottom; 10 s for both). Responses are similarly rapid and closely track the change in stimulus concentration at the pore. H–J, Another fungiform taste bud showing baseline GCaMP fluorescence (H) and GCaMP fluorescence at peak of response to focally applied saccharin (50 mm) (I). Two cells that responded to saccharin (arrows) and one unresponsive cell (arrowhead) are indicated. I, Image is baseline-subtracted fluorescence, using a grayscale to show intensity. J, Black traces (top) represent responses to saccharin of two cells indicated by arrows in I. Gray trace (bottom) represents ΔF/F0 for the unresponsive cell (arrowhead). Black bars represent stimulus application. K–M, A different taste bud, showing responses of taste cells to 10 mm citric acid, displayed as in H–J. Scale bars: D, F, I, L, 10 μm. Brightness of image in A was enhanced for cell visibility.