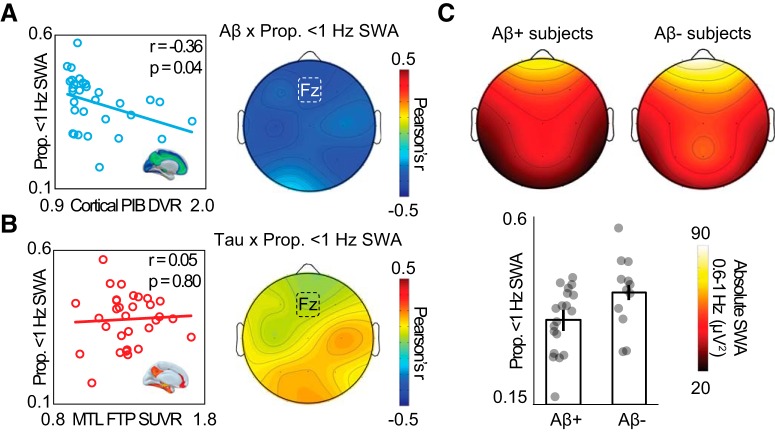
Figure 3.
Associations between NREM SWA, tau, and Aβ. A, Left, Negative association between proportion of 0.6–1 Hz SWA and cortical Aβ PET at electrode Fz. Right, Topography of correlation across all EEG electrodes. B, Left, No association between proportion of 0.6–1 Hz SWA and MTL tau PET. Right, Topography of correlation between proportion of 0.6–1 Hz SWA and MTL tau PET across all EEG electrodes. C, Top, Topography of 0.6–1 Hz SWA in Aβ-negative and Aβ-positive subjects. Bottom, Bar plots represent proportion of 0.6–1 Hz SWA in Aβ-negative and Aβ-positive subjects at electrode Fz. Error bars indicate SEM.

