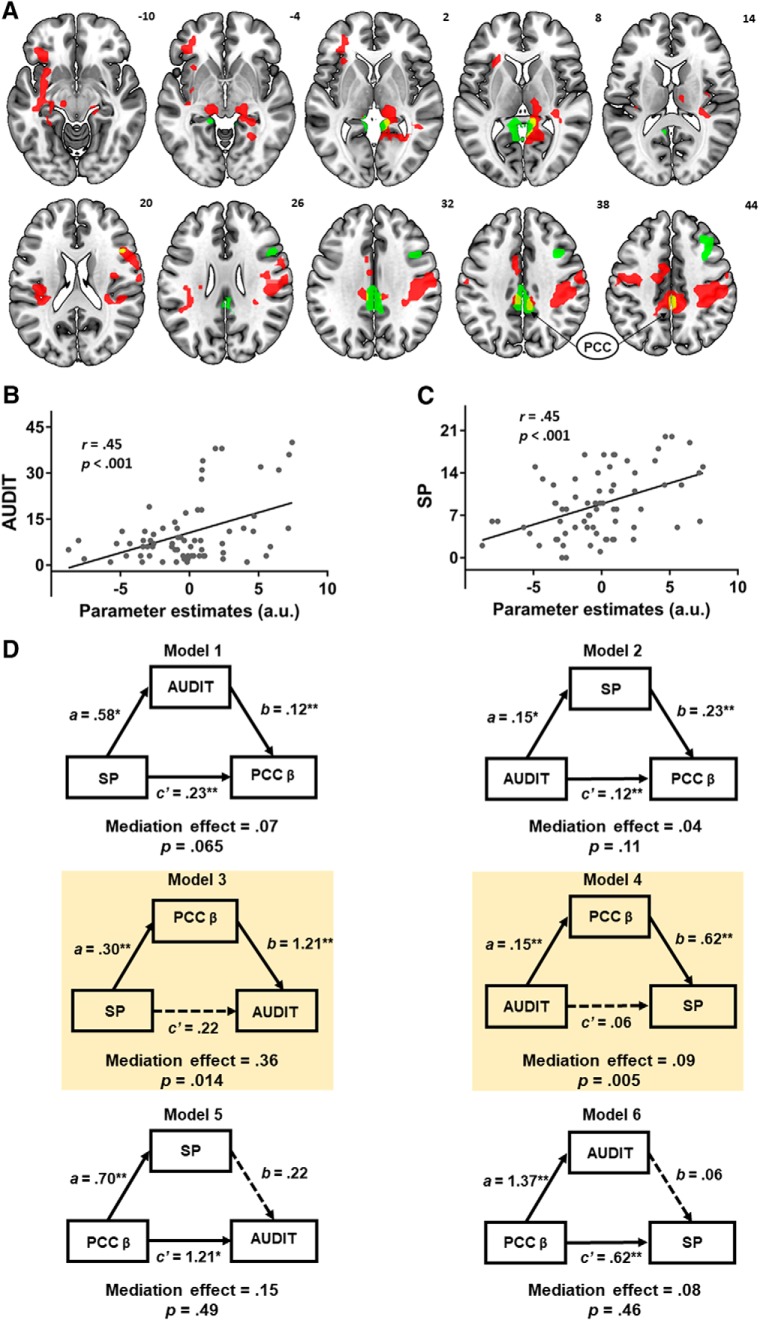
Figure 4.
A, Overlapping voxels (yellow) in the PCC were identified from two contrasts involving AUDIT (green) and SP (red) correlations with activity for NGS dollar > GS dollar. PCC activity was positively correlated with (B) AUDIT and (C) SP scores across all subjects. D, Mediation analysis. Model 1: SP → AUDIT → PCC activity; Model 2: AUDIT → SP → PCC activity; Model: 3 SP → PCC activity → AUDIT; Model 4: AUDIT → PCC activity → SP; Model 5: PCC activity → SP → AUDIT; and Model 6: PCC activity → AUDIT → SP. Both Model 3 and Model 4 showed a significant and complete mediation effect. * p < .05, ** p < .01.

