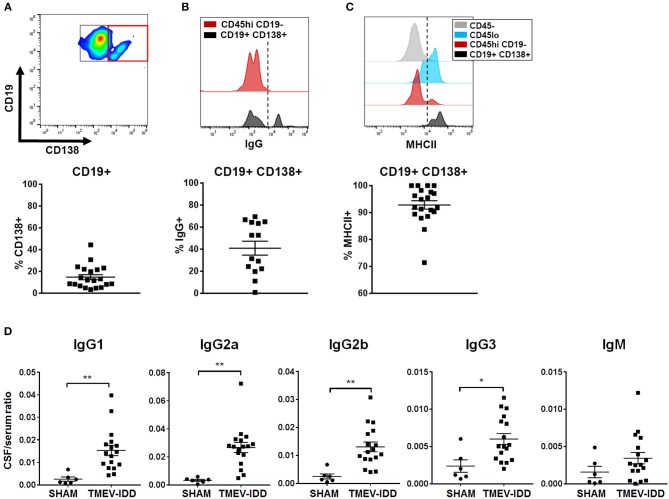
Figure 2.
Accumulation of isotype-switched B cells, including ASC, coincides with intrathecal Ig synthesis. (A) Gating strategy for CD138+ ASC (red box) among CD45hi CD19+ cells (top). Scatter plots showing total percentage of CD19+ CD138+ cells (bottom) among CD45hi CD19+ B cells for individual TMEV-IDD spinal cords at day 130 p.i. with mean ± SEM for the group. (B) Histogram (top) depicts IgG expression among CD45hi CD19− non-B cell immune cells as a negative control (red) and IgG expression among CD19+ CD138+ ASC (black). Dotted line denotes cutoff for positive gating of IgG+ cells. Total percentage of IgG+ cells (bottom) among CD45hi CD19+ CD138+ B cells for individual mice and mean ± SEM for the group. (C) Histogram (top) shows MHCII expression among CD45− (astrocytes/neurons/oligodendrocytes; gray) as a negative control, with elevated expression among CD45lo microglia (blue) and CD45hi CD19− non-B cell infiltrating immune cells (red) serving as positive controls. Histogram highlights elevated MHCII expression among CD19+ CD138+ cells (black). Dotted line denotes cutoff for positive gating of MHCII+ cells. Total percentage of MHCII+ (bottom) among CD45hi CD19+ CD138+ B cells for individual mice and mean ± SEM for the group. (D) Immunoglobulin (Ig) protein levels were measured in individual CSF and serum samples using Luminex® technology to measure 6 Ig isotypes simultaneously. Scatter plots depict individual CSF/serum ratios of IgG1, IgG2a, IgG2b, IgG3, or IgM and mean ± SEM for the group. IgA showed no significant differences in CSF/serum ratio compared to sham. Significant differences between sham and TMEV mice are indicated by *(p < 0.05) or **(p < 0.01) as determined by an unpaired Student's t-test.

