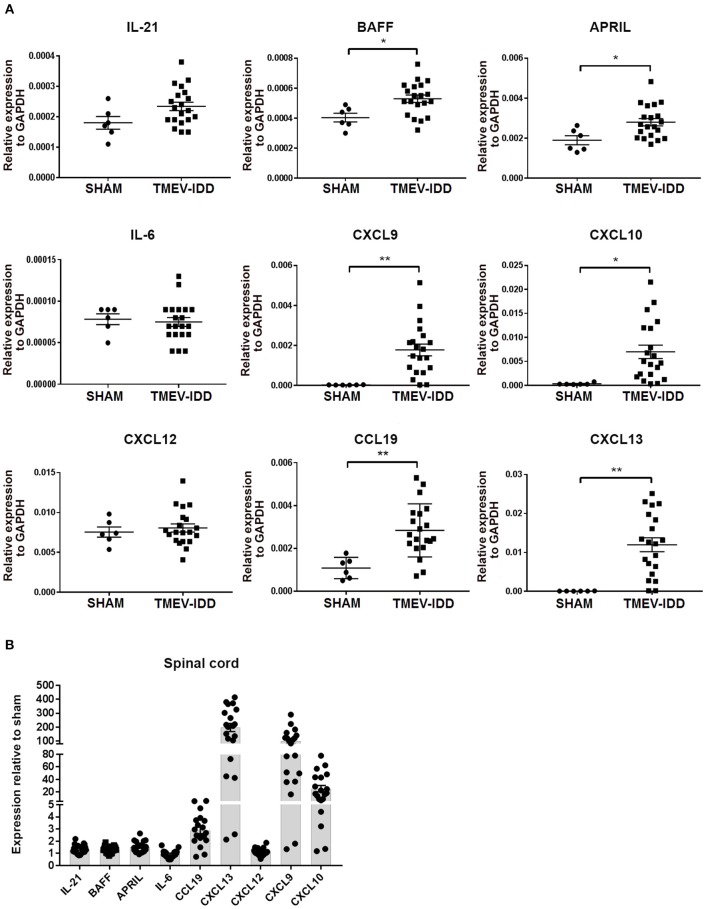
Figure 6.
B cell accumulation in the central nervous system coincides with enhanced transcript expression of B-cell supportive chemokines. (A) Relative gene expression levels for IL-21, BAFF, APRIL, IL-6, CXCL9, CXCL10, CXCL12, CCL19, CXCL13 in the spinal cords of individual sham and chronic TMEV-infected mice (day 130 post-infection -p.i-), normalized by the housekeeping gene glyceraldehyde phosphate dehydrogenase (GAPDH) with mean ± SEM plotted for each group. (B) Scatter plot showing fold-changes in cytokine and chemokine expression compared to sham mice. The fold-change was obtained by normalizing the gene expression number to those of GAPDH, then comparing the samples to the average GAPDH-normalized gene expression in sham mice. Data depict the means ± SEM for at least 6 to 8 individual infected mice and 2 sham mice derived from three independent experiments. Significant differences between sham and infected are indicated (*P < 0.05; **P < 0.005). In all cases, a P value of <0.05 was considered significant, as determined by an unpaired Student's t-test or Mann-Whitney U-test.

