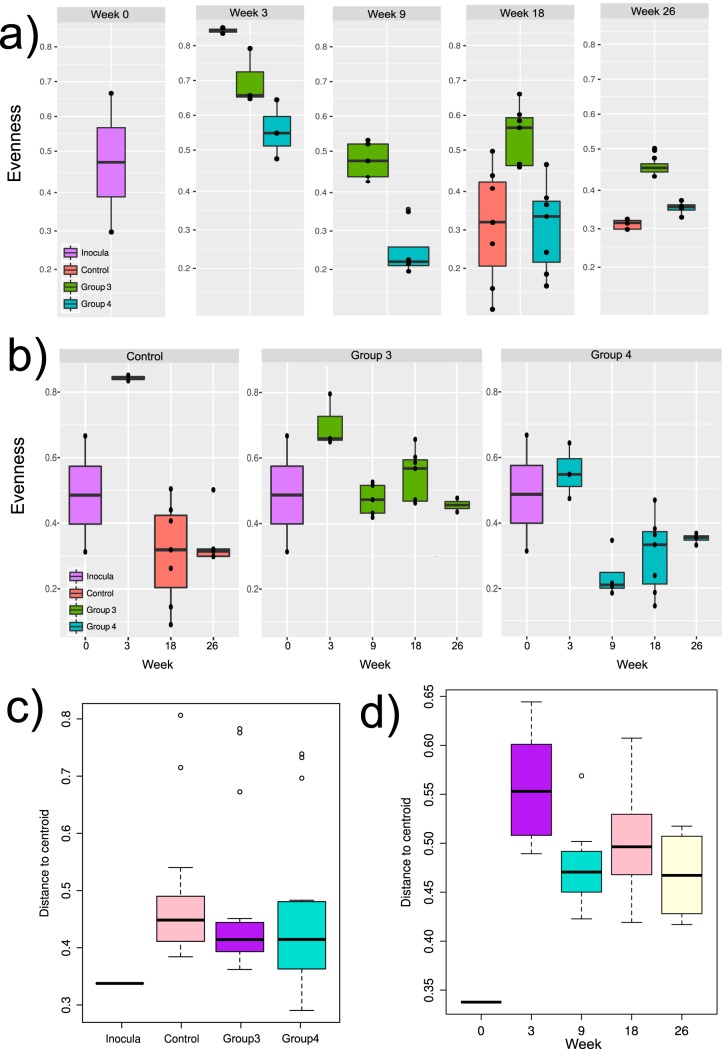
FIG 2.
Changes in diversity in the different microbiomes. (a) Diversity measured as Pielou’s evenness (J′) index comparing the profiles by the week of the experiment. (b) Diversity measured as Pielou’s evenness index comparing the profiles by experimental group. (c) Box plots of beta diversity, measured as the average steepness (z) of the species-area curve in the Arrhenius model (S = cXz) comparing the profiles by experimental group. (d) Box plots of beta diversity, measured as the average steepness of the species-area curve in the Arrhenius model (S = cXz) comparing the profiles by the week of the experiment. Beta diversity is based on the ratio of total number of species in a collection of sites (S) and the average richness per one site. As described in the R package ‘vegan’ vignette, X is the size of the sample. Parameter c is uninteresting, but z gives the steepness of the species area curve and is a measure of beta diversity.

