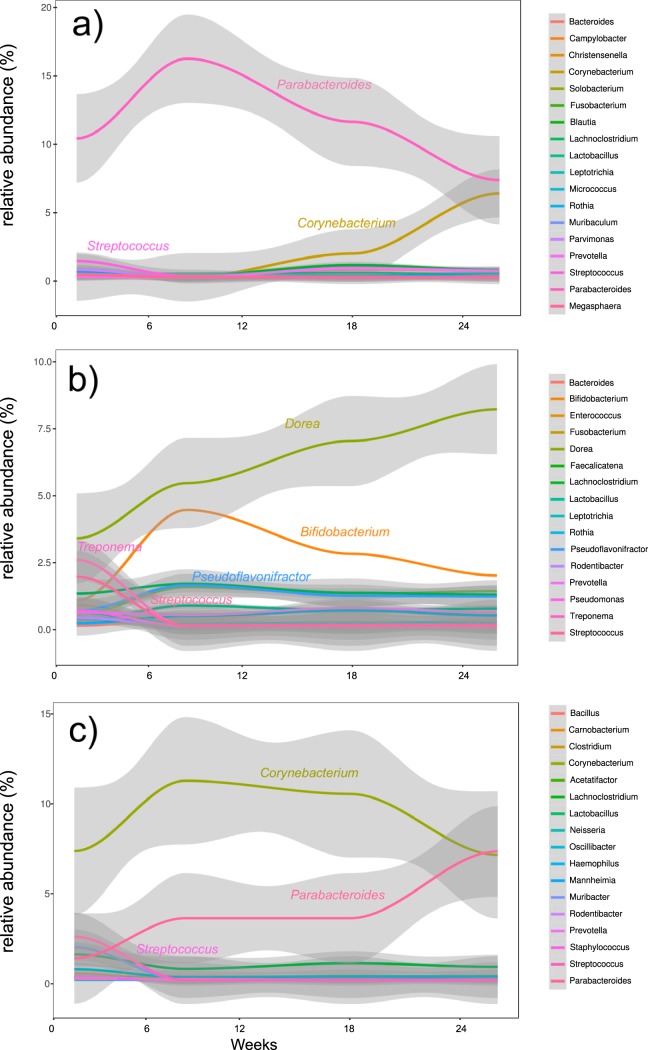
FIG 5.
Relative abundance trajectories of the different genera during the duration of the experiment. The graphs show the relative abundance (y axis) of the most common bacterial genera over time (x axis). Shaded regions indicate 95% confidence intervals. (a) Group 1 (no 4-NQO treatment and inoculation with the murine OSCC-associated microbiome; (b) group 3 (4-NQO treatment and inoculation with the murine health-associated microbiome); (c) group 4 (4-NQO treatment and inoculation with the murine OSCC-associated microbiome).

