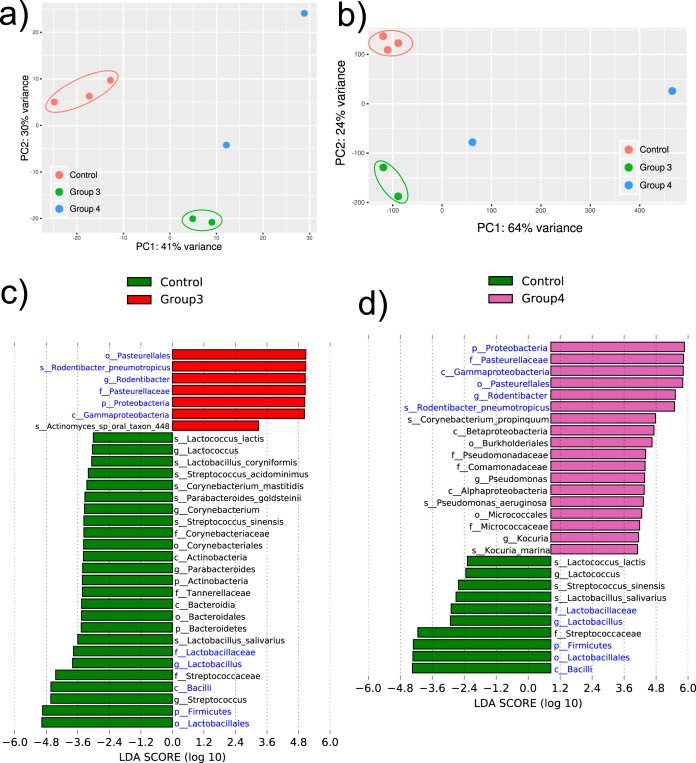
FIG 6.
Statistical differences in the phylogenetic composition of different active microbiomes and community-wide expression profiles. Metatranscriptome hit counts were obtained by comparison of the sequences against an in-house mouse oral microbiome database using the Kraken algorithm. (a) PCA based on the phylogenetic composition of the active communities based on metatranscriptomic results (Kraken profiles). (b) PCA based on the raw community-wide expression profiles of the different samples. (c) Histogram of the LDA scores computed for features by linear discriminant analysis (LDA) effect size (LEfSe) analysis, showing bacteria that were altered between group 1 (control) and group 3. Green, control (no 4-NQO treatment and inoculation with the murine OSCC-associated microbiome); red, group 3 (4-NQO treatment and inoculation with the murine health-associated microbiome). (d) Histogram of the LDA scores computed for features by linear discriminant analysis effect size analysis showing bacteria that were altered between group 1 (control) and group 4. Green, control (no 4-NQO treatment and inoculation with the murine OSCC-associated microbiome); purple, group 4 (4-NQO treatment and inoculation with the murine OSCC-associated microbiome). The alpha value for the Kruskal-Wallis (KW) sum-rank test was 0.1, and that for the Wilcoxon test was 0.05. Only taxa with an LDA of >3 are represented. Blue, taxa that were also identified to be altered using the HUMAnN2 pipeline (see Fig. S7 in the supplemental material).

