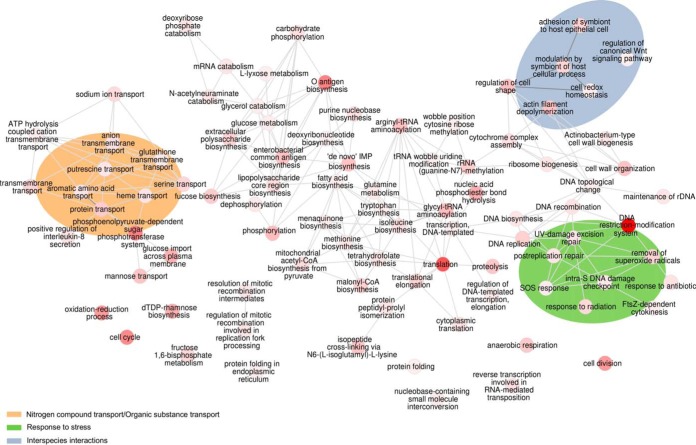
FIG 7.
GO enrichment analysis for the metatranscriptome profiles of the oral mouse microbiome associated with cancer status. Overrepresented biological processes are indicated. Enriched terms were obtained using GOseq, and the terms were summarized and visualized as a network using the REVIGO webpage. The bubble color indicates the user-provided P value (the value for darker red is closer to 0). Edges in the graph link highly similar GO terms. CoA, coenzyme A; rDNA, rRNA gene.

