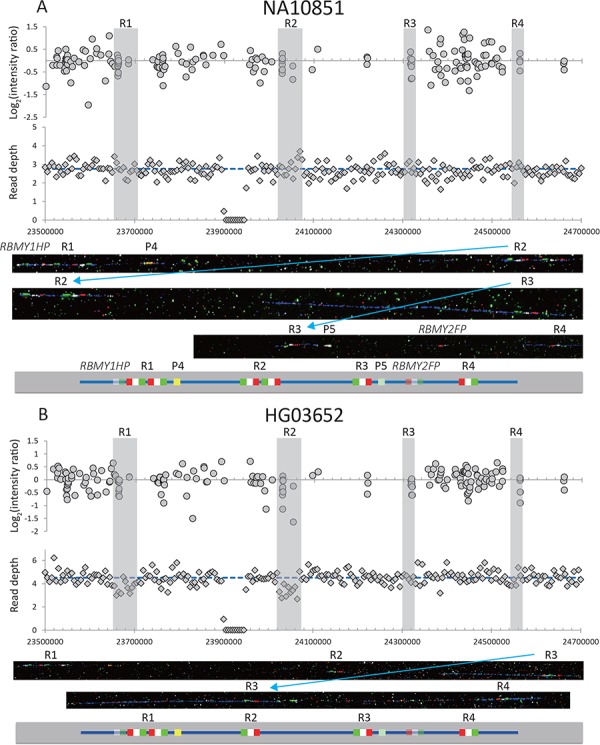
Figure 1.

Examples of two samples from the 1000 Genomes Project with different low RBMY1 copy numbers. (A) NA10851 (six copies of RBMY1, the same as the reference sequence) and (B) HG03652 (five copies). The upper panel shows the log2 ratio intensity plots from array CGH data and the read depth of 5 kb non-overlapping windows from the whole-genome sequencing data. The blue dashed line shows the mean read depth in the unique Y-chromosomal region for each sample. Regions ‘1’–‘4’ are highlighted in grey. Below are fibre-FISH images and a schematic interpretation of the RBMY1 gene FISH signals: RP11-95B23, blue; P1, red; P2, white; P3, green; P4, yellow; and P5, light green.
