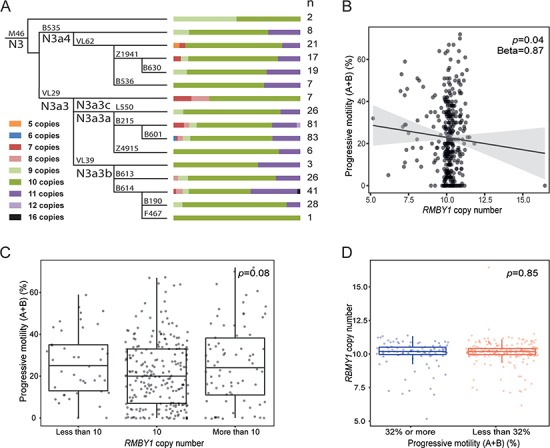
Figure 5.

(A) Phylogenetic relationships and RBMY1 copy number distribution among Estonian idiopathic subjects. Coloured bars indicate the proportion of samples carrying each copy number state; n, number of samples. (B) Correlation of RBMY1 copy number and sperm motility in the Estonian cohort. The P-value and unstandardized beta from the linear regression test is shown. (C) The distribution of progressive sperm motility of the Estonian cohort divided into three groups based on RBMY1 copy number: less than 10, equal to 10 and more than 10. The P-value from the Kruskal–Wallis test is shown. (D) The distribution of RBMY1 copy numbers in Estonian cohort divided into two groups according to the progressive sperm motility: 32% or more and less than 32%. The P-value from the Wilcoxon rank sum test is shown.
