
Figure 3.
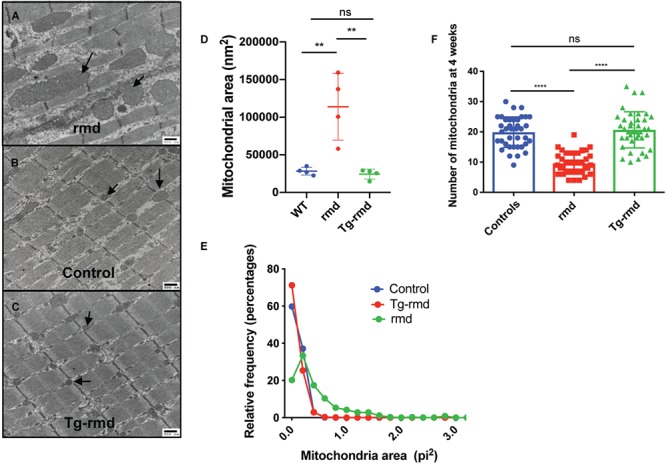
Mitochondrial phenotype in Tg-rmd mice. Demonstration of megamitochondria in rmd mice (A), normal-sized mitochondria in WT littermates (B) and rescued, normal-sized mitochondria in Tg-rmd mice (C). Mitochondrial areas are rescued in Tg-rmd (rescue) mice as compared to WT (control) and rmd (affected) littermates with Tg-rmd mice having mitochondrial areas closer in value to control mice (D). Tg-rmd mice show a higher percent of larger fibers (area of fibers) when compared to rmd mice (E). Mitochondrial numbers are restored in Tg-rmd mice compared to the decreased numbers in rmd mice, P < 0.0001 (D). N = 4 mice/sex/genotype, aged 4 weeks. Error bars represent mean with SD.