
Figure 1.
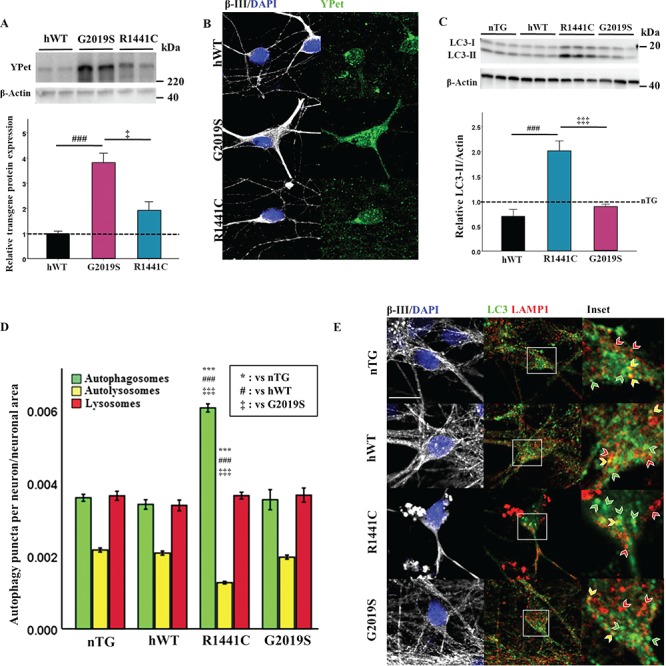
LRRK2-R1441C neurons exhibit alterations in basal autophagy. (A) Primary cortical neuronal cultures from P1 pups were generated and characterized. Western blots for YPet expression were quantified to assess transgene protein level and normalized to hWT levels. (B) Cultures at DIV 14 were stained for MAP2 and YPet to assess transgene expression in neurons. (C) Westerns blots for LC3-II were quantified and normalized to nTG littermate controls (dotted line = nTG normalized average; bars = mean +/− SEM; N = 3; *P < 0.05, ***P < 0.001; one-way ANOVA, Tukey HSD post hoc). (D, E) DIV 14 primary cortical cultures were fixed and stained for β-III, LC3 and LAMP1, confocal images acquired and autophagy puncta number per neuron quantified and normalized to neuronal area. Bars represent mean +/− SEM. (N = 3; ***P < 0.001; Kruskal–Wallis non-parametric ANOVA, Bonferroni post hoc). *, versus nTG; #, versus hWT; ‡ versus G2019S. Scale bar = 5 μm. Arrow heads: red, lysosome; yellow, autolysosome; green, autophagosome.