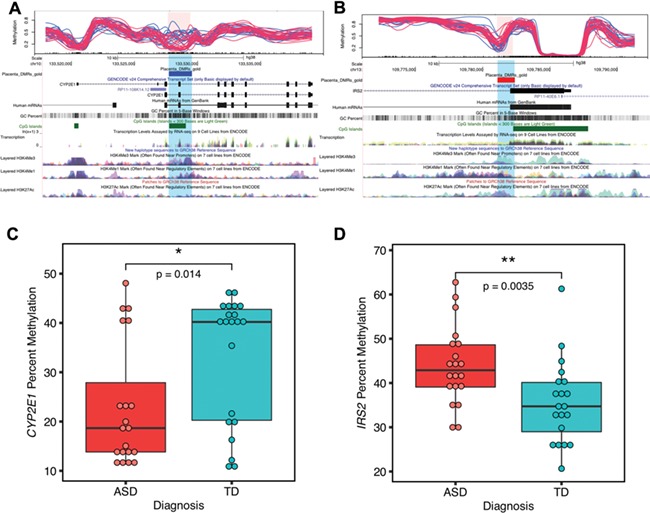
Figure 4.

Two genome-wide significant placental DMRs located at CYP2E1 and IRS2 were validated by pyrosequencing. (A) and (B) show the location relative to genes and CpG islands of the two genome-wide significant DMRs (highlighted in pink and blue) in the UCSC Genome Browser. In the upper tracks, each line represents percent methylation (y-axis) of a single individual by WGBS analysis. Blue lines represent TD, and red lines represent ASD samples. (A) Hypomethylated DMR at CYP2E1 with 10 kb upstream and 10 kb downstream. (B) Hypermethylated DMR at IRS2 with 10 kb upstream and 10 kb downstream. (C) The CYP2E1 DMR percent methylation was significantly associated with child outcome and verified by pyrosequencing (two-tailed t-test, P = 0.014). The y-axis represents the average percent DNA methylation across the DMR regions from pyrosequencing. Each dot represented one sample. (D) Pyrosequencing validation on IRS2 DMR’s methylation with child outcome (two-tailed t-test, P = 0.0035). *P < 0.05, **P < 0.01.
