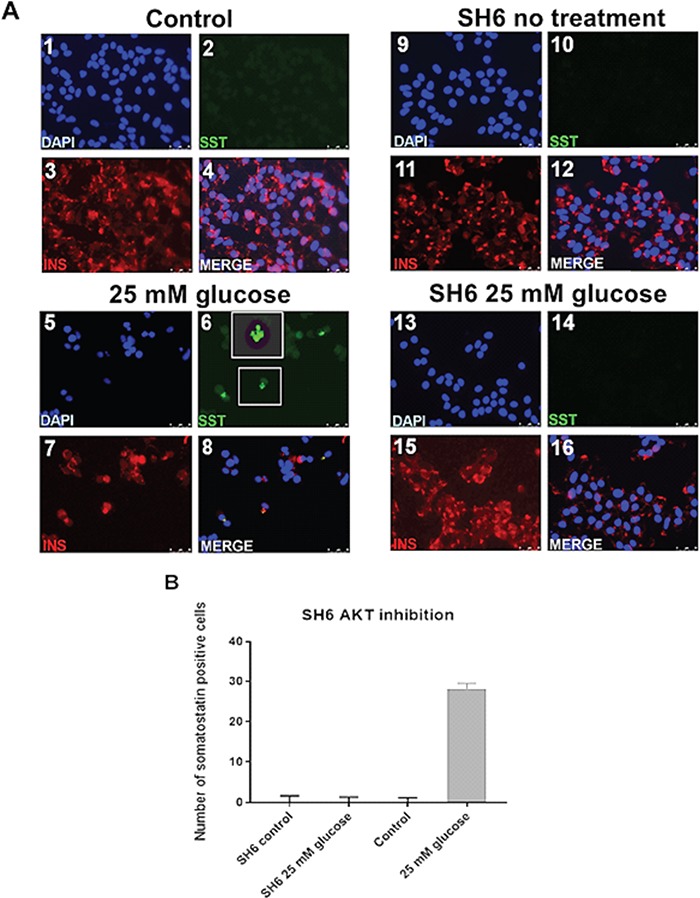
Figure 6.

Hormone staining and gene expression changes following restoration of splicing factor expression using the AKT inhibitor SH-6. This figure illustrates the rescue of beta cell phenotype in EndoC-βH1 cells following restoration of splicing factor expression to that seen in normal glucose conditions. (A) Panels 1–4 are representative immunofluorescence images from untreated EndoC-βH1 cells. Panels 5–8 are representative immunofluorescence images from EndoC-βH1 cells treated with 25 mM glucose for 24 h. Panels 9–12 are representative Immunofluorescence images from EndoC-βH1 cells treated with SH-6 alone. Panels 13–16 are representative immunofluorescence images from EndoC-βH1 cells treated with 25 mM glucose and SH-6 for 24 h. The identity of the antibody used to stain is indicated in each panel. (B) Graph showing the number of SST-positive cells under different culture conditions.
