Figure 1.

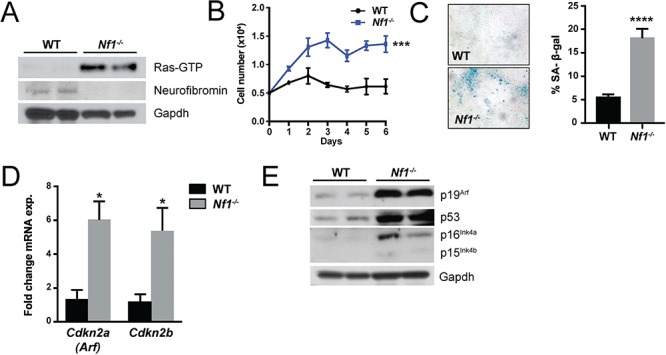
Loss of neurofibromin drives Schwann cell senescence. (A) Ras-GTP activity, neurofibromin and Gapdh (loading control) were detected in WT and Nf1−/− SC progenitors by western blot. (B) Proliferation of WT and Nf1−/− SCs was assessed by manual cell counting. n = 3 biological replicates per genotype at each time point. ***P < 0.001 WT versus Nf1−/− by two-way ANOVA. (C) Representative photomicrographs of β-galactosidase stained WT and Nf1−/− primary SCs. The percentage of β-galactosidase positive staining cells was quantified. n = 3 biological replicates per genotype. ****P < 0.0001 WT versus Nf1−/− by Student’s t-test. (D) Expression of senescence associated transcripts, Cdkn2a(Arf) and Cdkn2b in WT and Nf1−/− SCs. n = 3 biological replicates per genotype. *P < 0.05 WT versus Nf1−/− by Student’s t-test. (E) Western blot of p19Arf, p53, p16Ink4a, p15Ink4b and Gapdh (loading control) in WT and Nf1−/− SCs.
