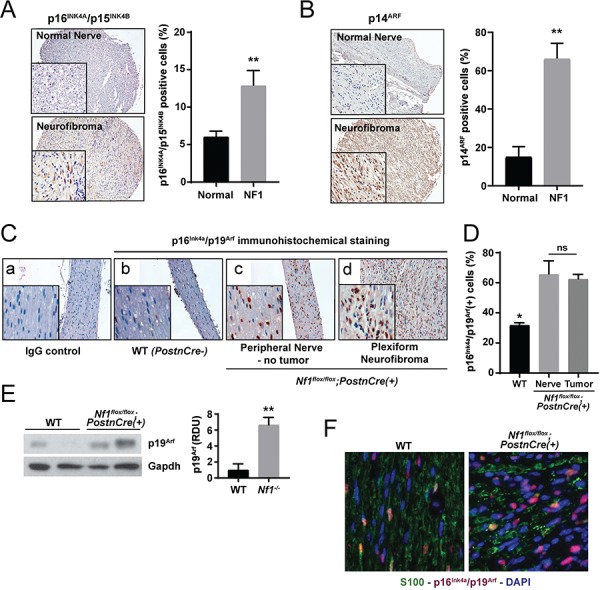
Figure 2.

Murine and human PN exhibit a senescence signature. (A) IHC staining for p16INK4A/p15INK4B was performed on human PN and healthy control nerve tissues. The percentage of p16INK4 positive staining cells was quantified. n = 8 biological replicates for PN and n = 7 biological replicates for control nerve tissue. **P < 0.01 PN versus normal nerve control by Student’s t-test. (B) IHC for p14ARF in human PN and healthy control nerve tissues. The percentage of p14ARF positive staining cells was quantified. n = 8 biological replicates for PN and n = 4 biological replicates for control nerve tissue. **P < 0.01 PN versus normal nerve control by Student’s t-test. (C) IHC staining of p16Ink4a/p19Arf expression in peripheral nerve tissue from WT and PN bearing Nf1flox/flox;PostnCre(+) mice. (D) The percentage of p16Ink4a/p19Arf-positive staining cells was quantified. n = 3 biological replicates per group. *P < 0.05 for WT versus Nf1flox/flox;PostnCre nerve and tumor tissue. No statistically significant difference (ns) comparing Nf1flox/flox;PostnCre nerve and tumor bearing tissue. (E) Western blot of p19Arf and Gapdh in the trigeminal nerve tissues of WT and Nf1flox/flox;PostnCre(+) mice. Expression was normalized to Gapdh and quantified in relative densitometry units. **P < 0.01 WT versus Nf1flox/flox;PostnCre(+) by one-way ANOVA followed by Tukey’s multiple comparisons test. n = 5 biological replicates per genotype as shown on expanded panel in Supplementary Material, Figure S1. (F) IF with anti-S100 (GFP), anti-p16Ink4a/p19Arf (RFP) and nuclear (DAPI) markers. Representative merged photomicrographs are shown at 20× magnification.
