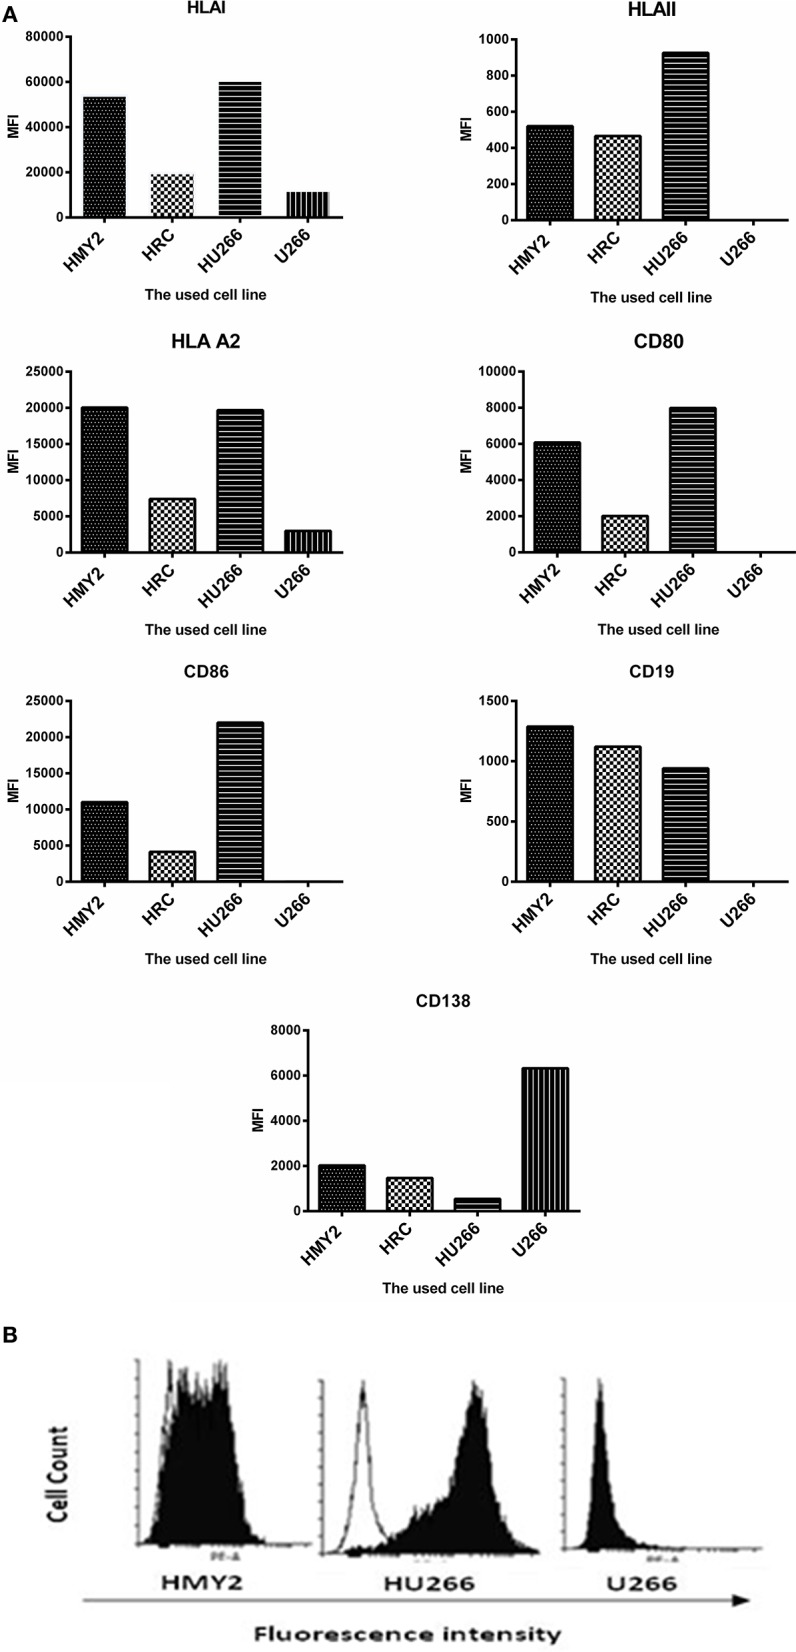
Figure 1.

Phenotypic characterization of HMY2, the hybrid cell lines, and U266. (A) Mean fluorescence intensity (MFI) of FACS analysis for determination of the expression of HLA class I, HLA-A2, HLA class II, CD80, CD86, CD19, and CD138. (B) A representative example of flow cytometry histograms showing expression of co-stimulatory marker CD86 on HU266, the APC cell line HMY2 and the myeloma cell U266. The analyses were conducted at least twice.
