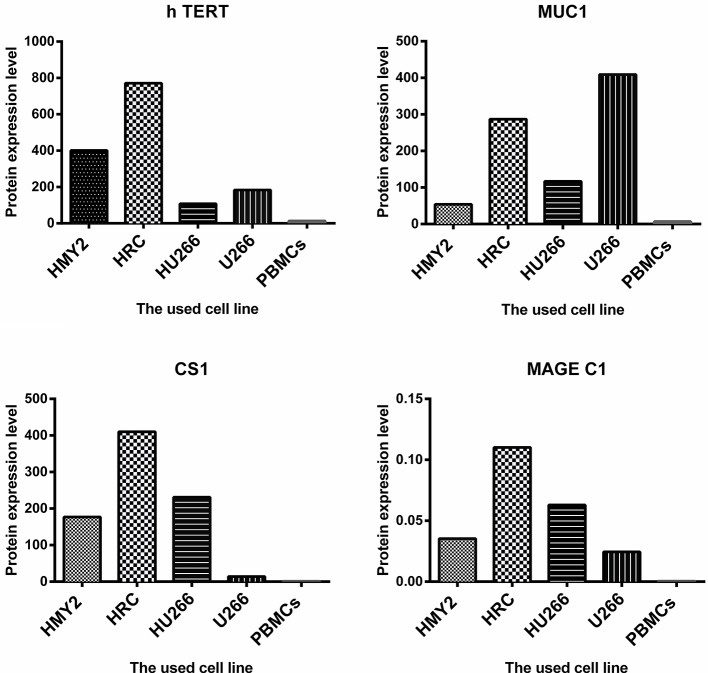
Figure 2.
The level of protein expression of the indicated antigens by the used cell lines. For MUC1, h TERT, and CS1, the presented values are the MFI of FACS analysis (means of two). For MAGE C1, the values were determined by imaging densitometry following Western blot (mean of two). The presented MFI values are (the MFI of examined marker expression—MFI of matched isotype control).

