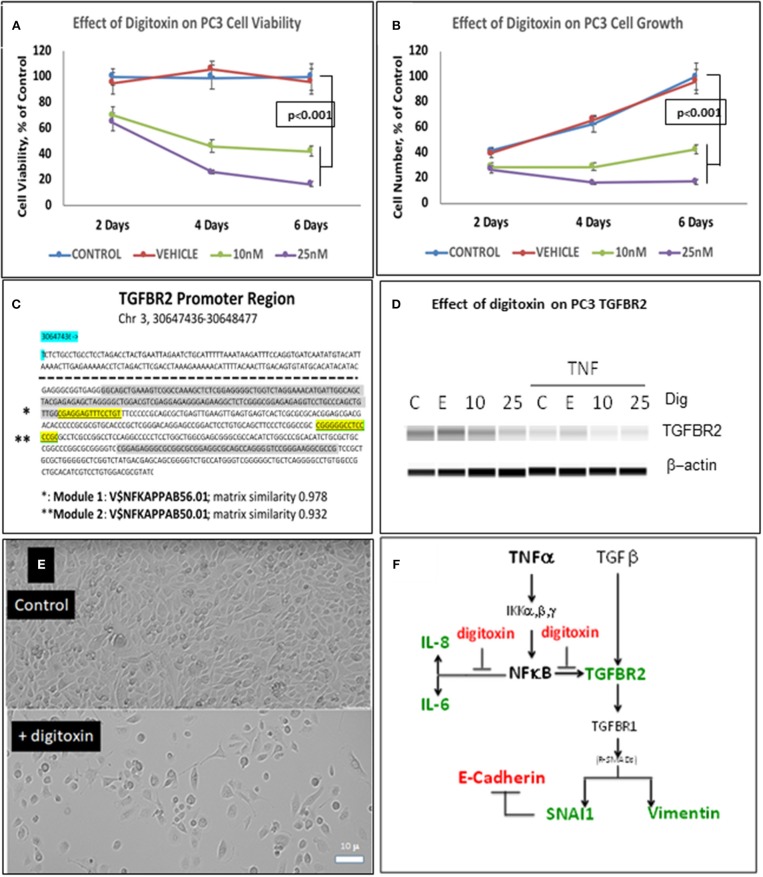
Figure 2.
Influence of digitoxin on PC3 and Hela cell viability and growth, and on expression of TGFBR2 protein in PC3 cells. (A) Effect of digitoxin on PC3 cell viability. Conditions and abbreviations are as in part A. (B) Effect of digitoxin on PC3 cell growth. Conditions and abbreviations are as in part A. (C) TGFBR2 Promoter sequence analysis. Data are from the Genomatix Pathway System. Module 1 (*) is a composite tandem module of transcription factors composed of two KLFS (Krupple-like Transcription Factor sequences; * gray color code), followed by an NFκB family member p65 (RELA, * highlight). This is the “strongest” NFκB promoter. Module 2 (**) is the “less strong” NFκB site, and is juxtaposed to a Sp1 site (** gray color code). Matrix Similarity is scored as 1.000 being 100% strength and 0.900 being 10% strength. For clarity, the dotted line represents sequences distal to proximal regions containing the two κB sequences. (D) Influence of digitoxin on TGFBR2 expression in PC-3 Cells. PC-3 cells were cultured for 3 days with TNFα (10 ng/ml), and either 0, 10 or 25 nM digitoxin. Fresh media, with TNFα and digitoxin, were added each day. Capillary Western blot analysis (Protein Simple, San Jose, CA), shown here, was carried out as described in Methods. (E) Influence of digitoxin on PC cell culture morphology. Upper panel are PC-3 cells growing under vehicle control conditions for 3 days. Lower panel are PC cells growing in the presence of 25 nM digitoxin. The size marker in lower left of the lower panel is 10 microns. As expected from analysis of growth there are far fewer cells surviving in the presence of digitoxin. In all cases, all analytic data are normalized to the MTT signal to correct for cell number. (F) Summary: Digitoxin blocks EMT collaboration between NFκB and TGFβ signaling by inhibiting expression of TGFBR2 in PC3 cells. Downstream of TGFBR2 there is reduced Vimentin expression and elevation of E- Cadherin due to inhibition of SNAI1. Color code: red, elevated; green, reduced.

