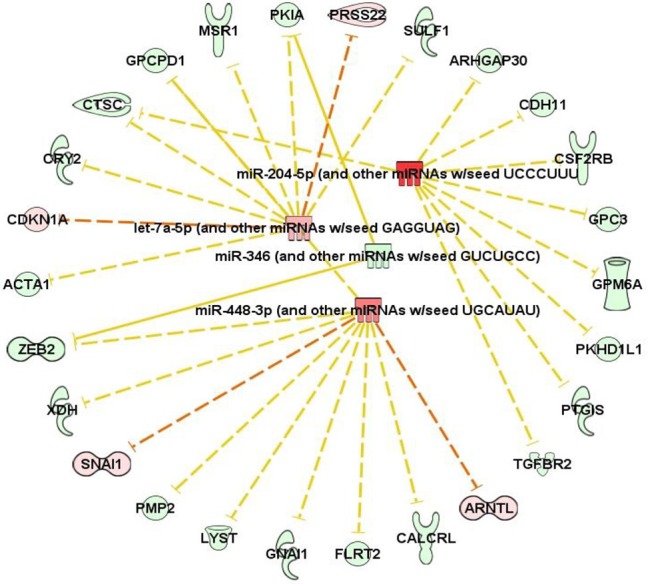
Table 3.
Digitoxin effects on microRNA content in primary tumors.
| MicroRNA | p-value | DDCt [Test, A–Control, B] | Fold-change (corrected to absolute values) |
|---|---|---|---|
| A | |||
| miR-346 | 0.034 | +5.05 | −33.1 |
| miR-98/let7a-5p | 0.019 | −3.18 | +9.06 |
| miR-448-3p | 0.026 | −3.93 | +15.24 |
| miR-211-5p/miR-204-5p | 0.040 | −4.59 | +24.08 |
| B | |||
 | |||
Panel A, DDCt (delta delta Ct) takes into account both the sample and a control. A negative or positive DDCt value corresponds to an increase or decrease, respectively, in fold change. A (+ digitoxin), n = 10; B (control), n = 11. Panel B, IPA analysis comparing predicted interactions of microRNAs with digitoxin-dependent mRNAs. Color Code: red (increased expression); green (decreased expression).
