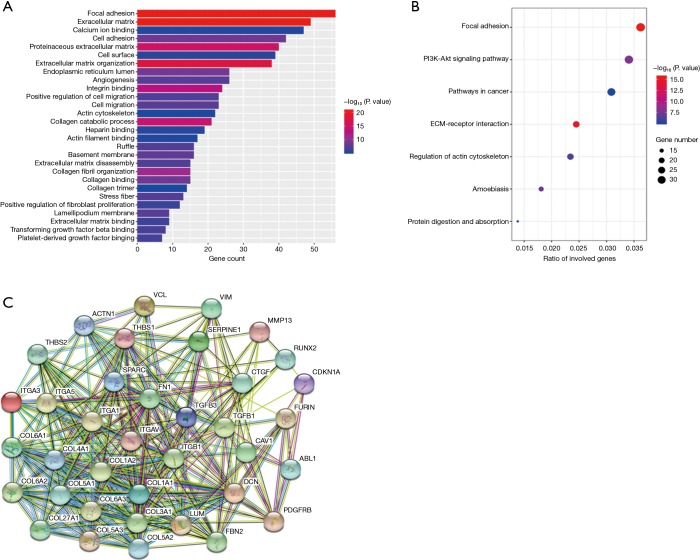
Figure 3.
Overview of significantly enriched GO and KEGG terms. The x-axis indicates the counts or ratio of involved genes and the y-axis represents the GO and KEGG terms. (A) Enriched GO terms. The length of the horizontal column represents the number of genes and their color indicates the P value. (B) Enriched KEGG terms. Each bubble represents a term. The size of the bubble indicates the number of involved genes. Lighter colors indicate smaller P values. (C) Network analysis of the prospective target genes of miR-30b-5p. Network nodes represent proteins. Colored nodes, query proteins, and first shell of interactors; white nodes, second shell of interactors. Small nodes, protein of unknown 3D structure; large nodes, some 3D structure is known or predicted. ESCC, esophageal squamous cell carcinoma; RT-PCR, real-time polymerase chain reaction; GO, Gene Ontology; KEGG, Kyoto Encyclopedia of Genes and Genomes.

