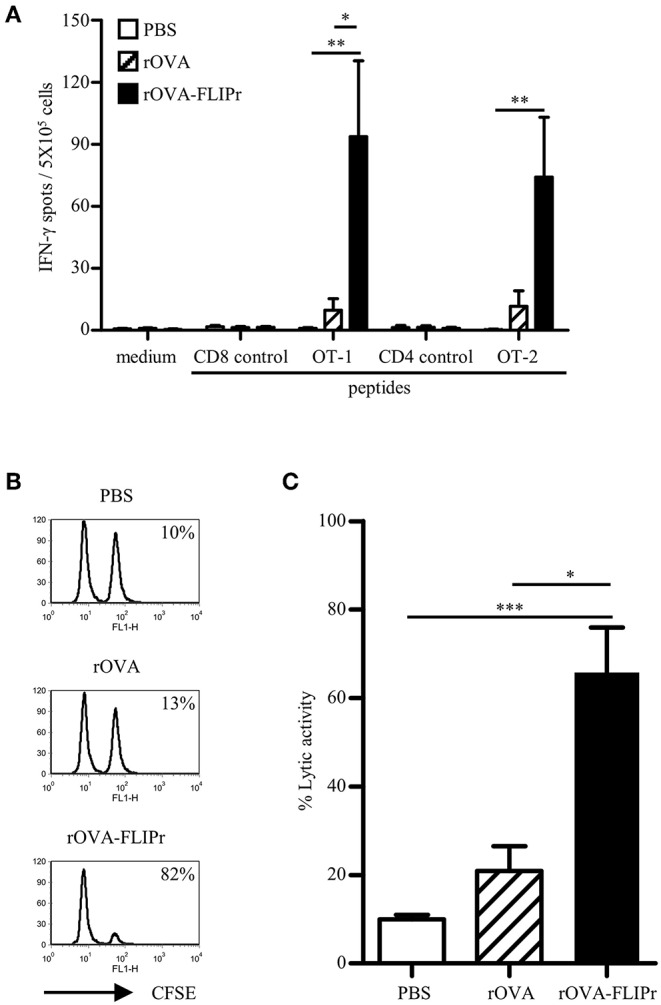
Figure 2.

Immunization of mice with rOVA-FLIPr enhances CD4+ and CD8+ T cell. Groups of C57BL/6 mice were immunized twice with 30 μg of rOVA or rOVA-FLIPr at a 2-week interval. Mice immunized with PBS were used as controls. (A) One week after the last immunization, splenocytes were incubated with OT-1, OT-2, or control peptides for 48 h in an anti-INF-γ-coated 96-well ELISPOT plate. The IFN-γ producing spots were determined using an ELISPOT reader. Results are expressed as the mean ± standard errors of the mean (n = 6, pooled from two independent experiments). (B) An equal mixture of OT-1 peptide-pulsed splenocytes (CFSEhigh) and control peptide-pulsed splenocytes (CFSElow) were injected into the immunized mice via intravenous routes. The immunized mice were sacrificed 18 h later and the killing of peptide-loaded splenocytes in spleen was analyzed by flow cytometry. Representative profiles of mice from each group are shown. (C) in vivo cytotoxic T lymphocyte killing was calculated by the formula: % specific lysis = [1–(%CFSElow/%CFSEhigh) before injection/(%CFSElow/%CFSEhigh) after injection] × 100%. Bars represent the mean percentage of specific lysis ± SEM in each group (n = 8, pooled from two independent experiments). The statistical significance was determined using the Kruskal-Wallis test with Dunn's multiple comparison test. *p < 0.05, **p < 0.01, and ***p < 0.001.
