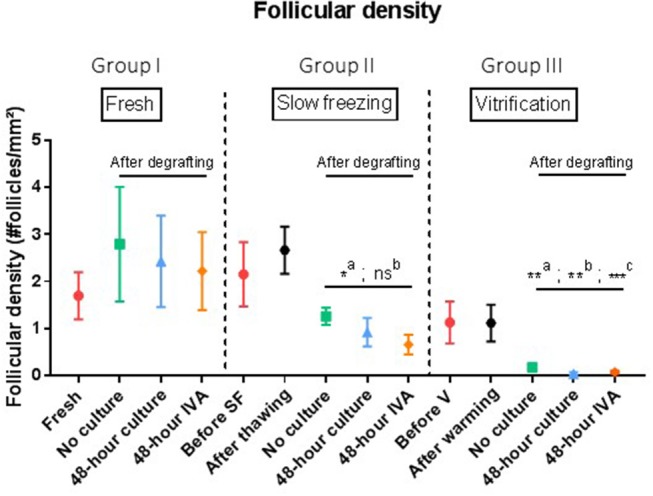
Figure 3.

Follicular density (follicles per mm2). Results are expressed as mean ± SEM. Before grafting, a piece of tissue from each group (fresh, SF, and V) was kept for control purposes. For the SF and V groups, controls were also conducted after thawing or warming the tissue. Tissues from the no culture, 48 h culture and 48 h IVA subgroups were retrieved after xenografting to mice. Intragroup comparison: In the SF and V groups, follicle density decreased significantly after grafting (a: p = 0.01). However, comparison of SF tissue (group II) with fresh tissue (group 1) did not show any significant difference in follicular density (p = 0.25, p = 0.39, and p = 0.25 for the no culture, 48 h culture and 48 h IVA subgroups, respectively). On the contrary, grafted tissue from the V group (group III) showed a dramatic decline in follicular density compared to the fresh group (p = 0.05, p < 0.01, and p = 0.02 for the no culture, 48 h culture, and 48 h IVA subgroups, respectively). SF, slow-frozen; V, vitrified; IVA, in vitro activation. a: intragroup analysis, before vs. after grafting, b: after grafting vs. after grafting group 1, **p ≤ 0.05, c: after grafting vs. after grafting group 2, *p = 0.01, **p < 0.01, ***p < 0.01.
