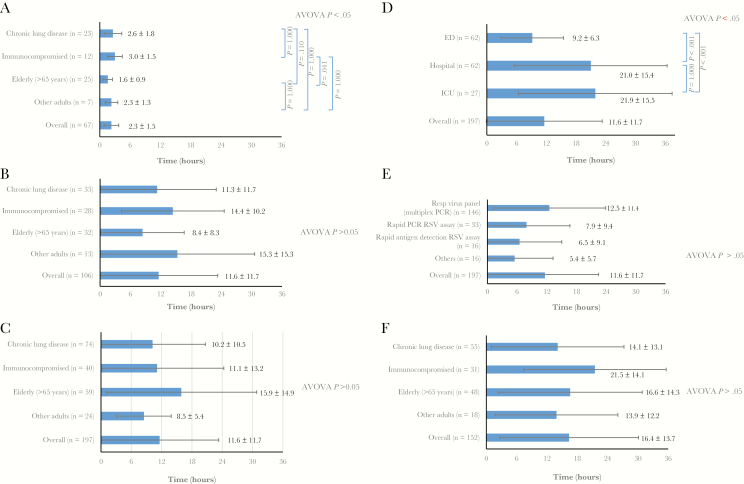
Figure 2.
A, B, Time intervals between hospital admission and test ordering for tests requested in the emergency departments (ED) (A) or in the hospital ward or intensive care unit (ICU) (B), shown according to the 4 risk groups. C‒E, Intervals between test ordering (in hospital wards or ICU) and receipt of respiratory syncytial virus (RSV) result, shown according to the 4 risk groups (C), location of test request (D), and diagnostic methods (E). F, Intervals between admission and receipt of RSV result, shown according to the 4 risk groups. Data are shown as mean values with standard deviations. Abbreviations: ANOVA, analysis of variance; PCR, polymerase chain reaction.

