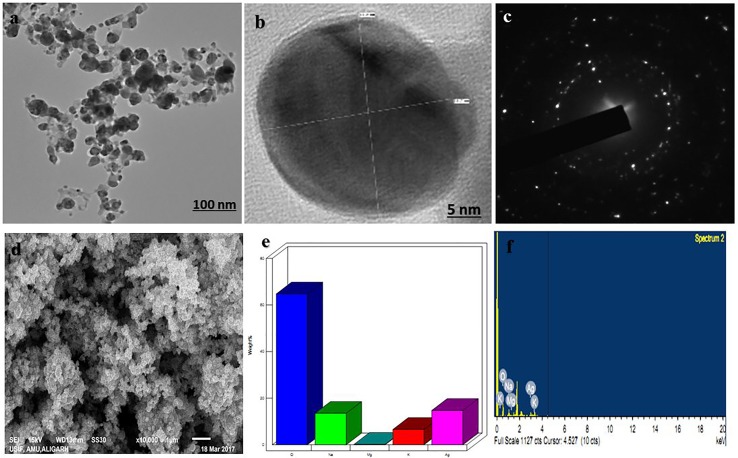
Figure 3.
Electron microscopic analysis of as-synthesized b-AgNPs. (A and B) Transmission electron microscopy (TEM) of AgNPs represents the structure of NPs at 100 nm scale and (B) at 5 nm scale. (C) The TEM image of the electron diffraction. (D) SEM micrograph depicts the NPs microstructure. (E and F) Energy dispersive X-ray (EDX)-spectrum is representing components of the NPs.

