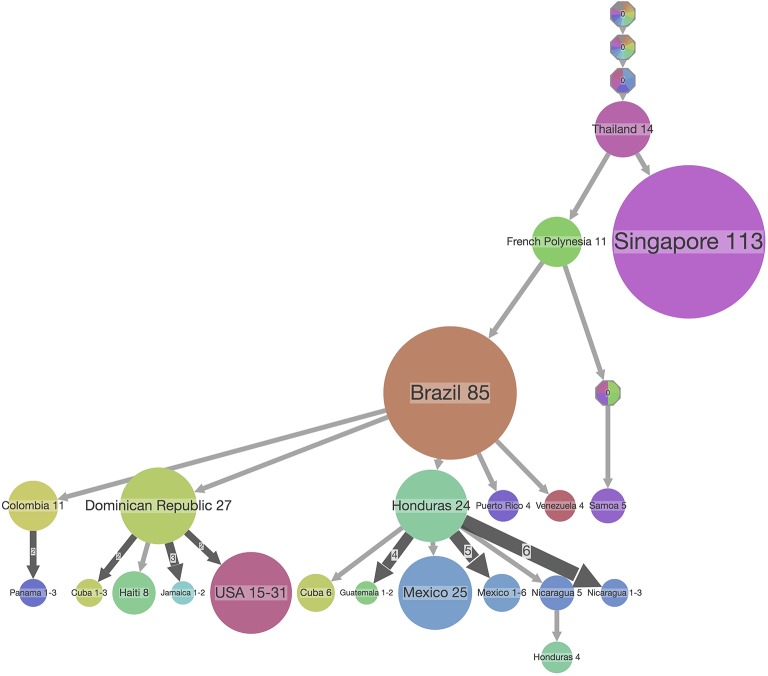
Figure 7.
PASTML summary visualization of the ancestral reconstruction of state locations of the ZIKV dataset used in Figure 6. The top-down visualization corresponds to an iterative clustering starting from the root of the tree at the top, with the size of the dot corresponding to the number of taxa in a clade which share the same ancestral state which is indicated on top of the dot. In this type of visualization, a compressed representation of the ancestral scenarios is visualized that highlights the main facts and hides minor details by performing both a vertical and horizontal merge [but see (33)]. The branch width corresponds to the number of times its subtree is found in the initial tree, and the circle size at a tip is proportional to the size of the compressed (or merged) cluster.

