
Figure 5.
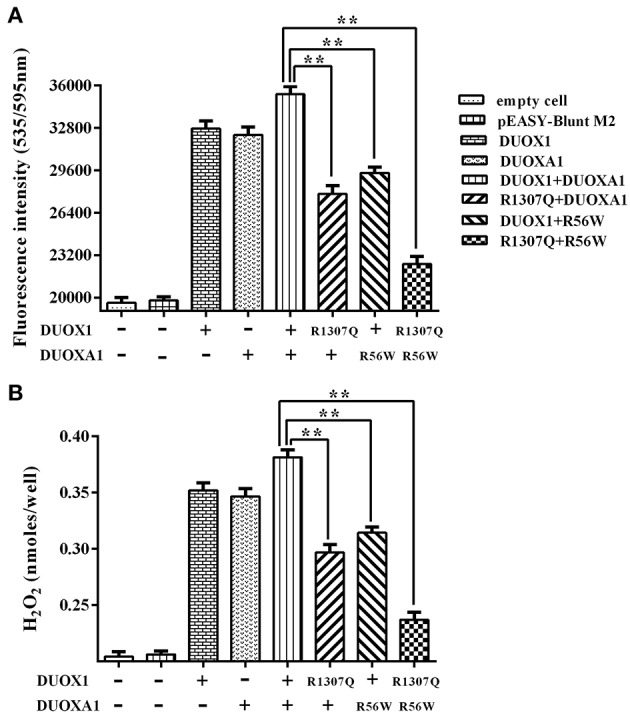
H2O2 generation in cells transfected with the indicated expression vectors. (A) Measurement of fluorescence intensity (535/595 nm) under various indicated vector transfections. The group transfected with both wild-type DUOX1 and DUOXA1 had the maximum fluorescence intensity. (B) Presentation of the data in nanomoles of H2O2. The results were transformed from fluorescence intensity using a calibration curve. Each column represents the mean ± SD of three independent experiments performed in triplicate. **P < 0.01.