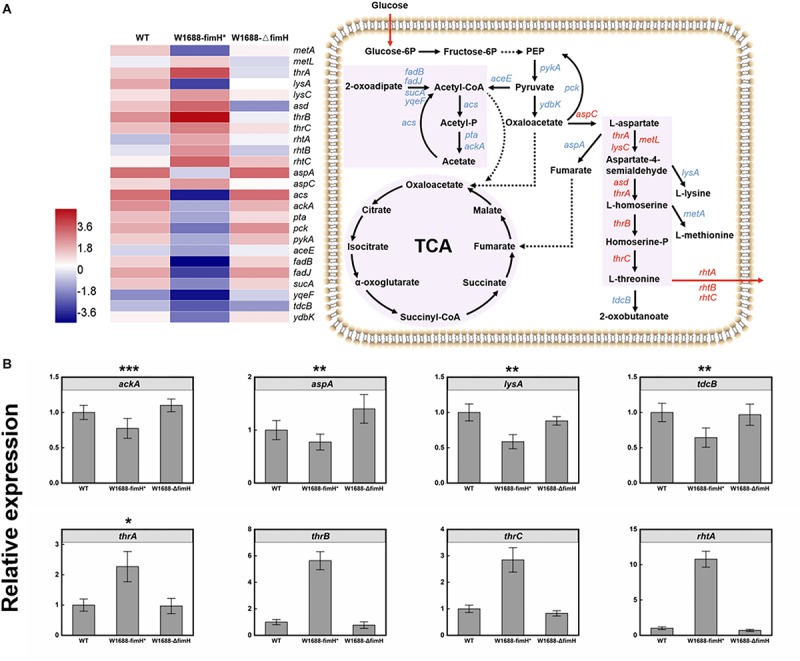
FIGURE 7.

(A) Transcriptome analysis of L-threonine biosynthesis pathway genes in three different strains and the expression levels of these genes in E. coli W1688-fimH*. Red and blue indicate up- and down-regulated genes, respectively. (B) qRT-PCR verification of the genes related to L-threonine biosynthesis and transportation. Values and error bars represent the mean and the s.d. (n = 3). ∗∗∗p < 0.001, ∗∗p < 0.01, *p < 0.05 as determined by two-tailed t-test.
