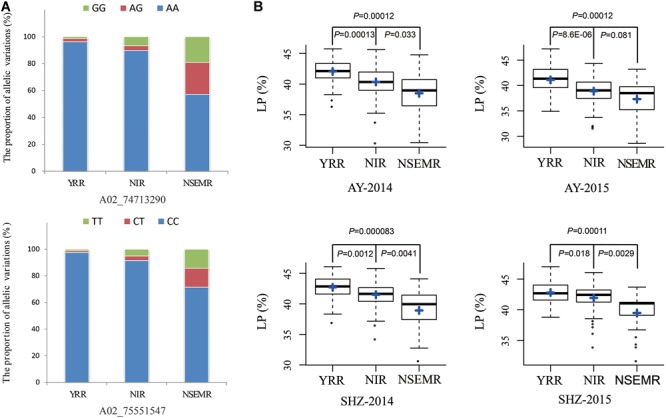
FIGURE 3.

Identification of the favorable allelic variations for two peak QTNs. (A) The distribution frequencies of the favorable allelic variations in three geographic areas (YRR, NIR, and NSEMR). (B) Box plots of lint percentage (LP) of the different allelic variations for two peak QTNs in three geographic areas.
