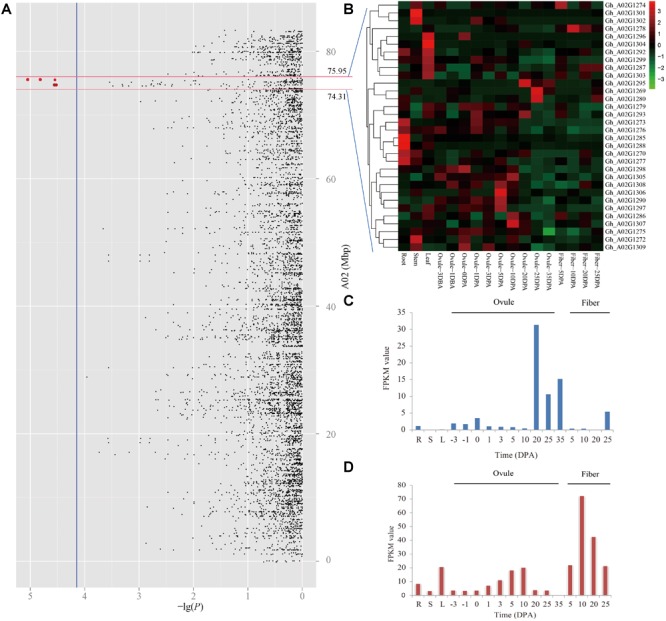
FIGURE 4.

Prediction of candidate genes for of lint percentage (LP). (A) Manhattan plots for LP on chromosome A02, the red dots indicates two peak QTNs (A02_74713290 and A02_75551547) which were detected by using SL-GWAS methods in the different planting environments. (B) Heatmap of expression level of 32 genes among 17 upland cotton tissues, the red represents high expression, and the green shows low expression. Expression levels of Gh_A02G1295 (C) and Gh_A02G1278 (D) in different tissues, including the root (R), stem (S), and leaf (L), in ovule- and fiber-development stages based on the FPKM value.
