Figure 1.
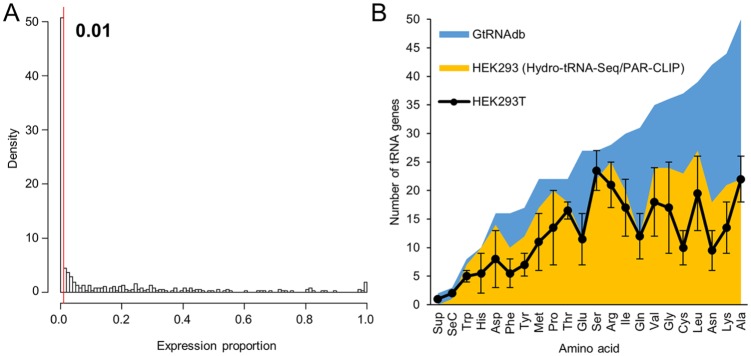
Number of tRNA genes significantly expressed in HEK293T cells: (A) histogram analysis of number of tRNA genes (Y-axis; density) distributed across ranges of proportional contribution to their isodecoder sets (X-axis; expression proportion); based on Iso-tRNA-CP analyses obtained for HEK293T cells.9 A defined threshold (expression proportion = 0.01 = 1%) is indicated. Note that ‘tRNA genes’ are defined as single tRNA genes or tRNA families comprising variable number of tRNA genes with identical mature tRNA sequences as defined by Torres et al.9 (B) Number of tRNA genes per isoacceptor set (tRNAs charged with the same amino acid) sorted by their gene copy number according to the GtRNAdb v2.0,2 (dark-area graph). Light-area graph represents the number of tRNA genes for each isoacceptor set expressed in HEK293 cells as evidenced by Hydro-tRNA-Seq and PAR-CLIP.15 Black points represent the number of tRNA genes expressed in HEK293T cells based on a proportional contribution of at least 1% to their isodecoder set as calculated by Iso-tRNA-CP.9 As, in this analysis, all isoacceptor sets contain tRNA gene families, the error bars represent the minimum and maximum number of expressed tRNA genes considering that at least one, and potentially all, members of the tRNA family are expressed. The line connecting each isoacceptor set point is shown for profile comparisons against the dark- and light-area graphs.
Abbreviation: Iso-tRNA-CP, isodecoder-specific tRNA gene contribution profiling.

