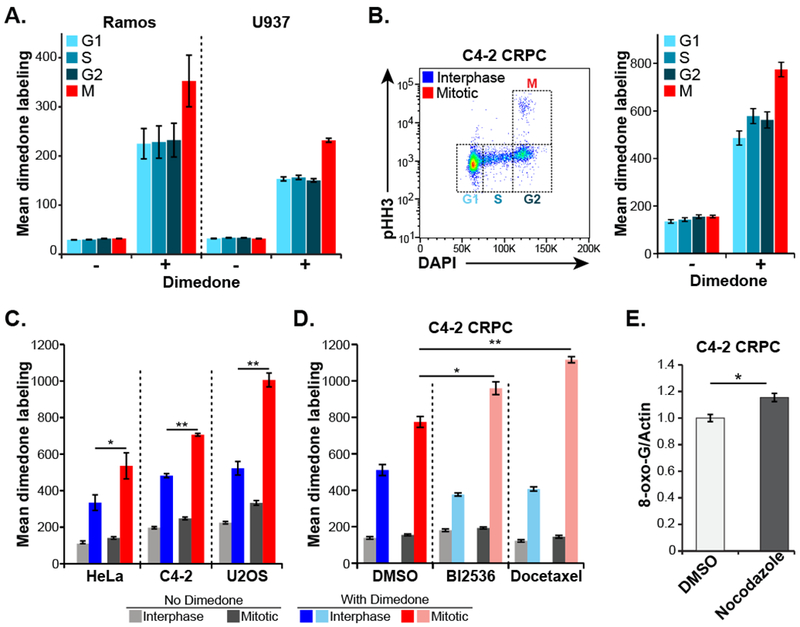
Figure 2. Oxidative damage of biomolecules increases in mitotic cancer cells.

A, Live asynchronous Ramos and U937 hematopoietic cells were labeled on oxidized protein cysteine residues with dimedone, then washed, fixed, stained for pHH3 and DNA content (DAPI) and analyzed by flow cytometry to determine cell cycle stage. “Mean dimedone labeling” was defined as the mean dimedone channel signal normalized to FSC on an individual cell basis. Mean ± SEM of three independent experiments are shown.
B, C4-2 CRPC cells were labeled and analyzed as in panel A. Shown is an example scatter plot with cell cycle distribution (left panel) and quantification of dimedone labeling (right panel) in each stage of the cell cycle.
C, Flow cytometry and dimedone labeling analysis was performed as in panel B on the indicated adherent cell lines. Gating was performed to separate interphase (G1, S and G2) cells from mitotic cells, and the data analyzed and plotted as above. Mean ± SEM of three independent experiments are shown. (* p < 0.05 ** p < 0.01 by two-tailed paired Student’s t-test).
D, Dimedone labeling analysis was performed in C4-2 CRPC cells treated with the indicated antimitotic drugs (BI2536, 10 nM; docetaxel, 2.5 nM) or DMSO vehicle for 24 hours. These cells were then analyzed for cell cycle distribution and cysteine oxidation levels, and plotted as in panel B. Mean ± SEM of three independent experiments are shown. (* p < 0.05 ** p < 0.01 using a two-tailed Student’s t-test).
E, Levels of 8-oxoguanine were assessed in C4-2 cells after a 16-hour treatment with nocodazole or DMSO control followed by drug washout and 24-hour recovery. Cells were fixed, stained with antibodies raised against 8-oxoguanine and normalized to actin. Mean ± SEM of three independent experiments are shown. (* p = 0.0195 using a two-tailed Student’s t-test).
