
Figure 3.
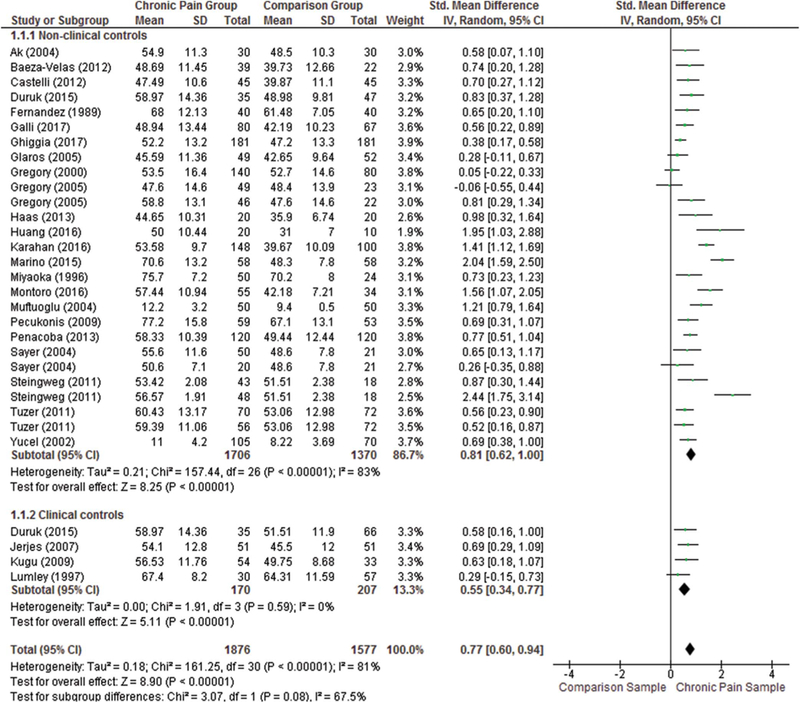
Forest plot depicting group differences in the alexithymia score between adults with chronic pain and nonclinical and clinical comparison samples.
Official websites use .gov
A
.gov website belongs to an official
government organization in the United States.
Secure .gov websites use HTTPS
A lock (
) or https:// means you've safely
connected to the .gov website. Share sensitive
information only on official, secure websites.
Forest plot depicting group differences in the alexithymia score between adults with chronic pain and nonclinical and clinical comparison samples.