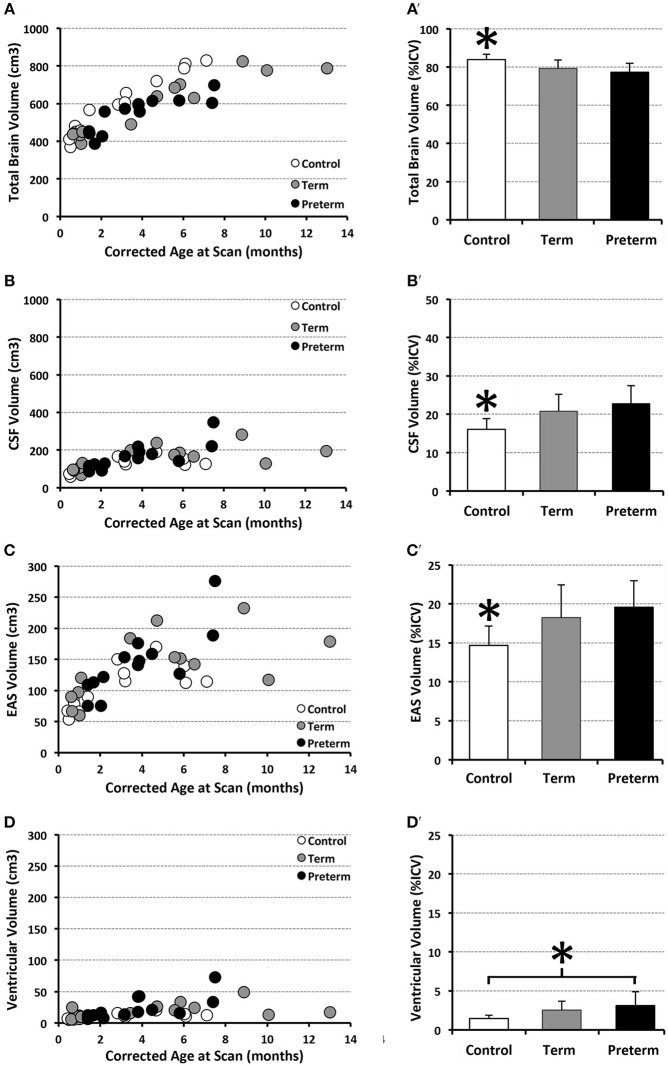
Figure 8.
Graphs show individual absolute (scatter plots) and mean normalized volumes (SD; bar graphs) as % intracranial volume (ICV) for whole brain (A,A') and total CSF (B,B'), as well as CSF sub-divisions of extra-axial space (EAS; C,C') and ventricular volume (D,D'). Graphs illustrate 3 groups analyzed: full-term (n = 13; gray circles) and pre-term patients (n = 13; black circles), and full-term naïve controls (n = 13 open circles). *p < 0.05.

