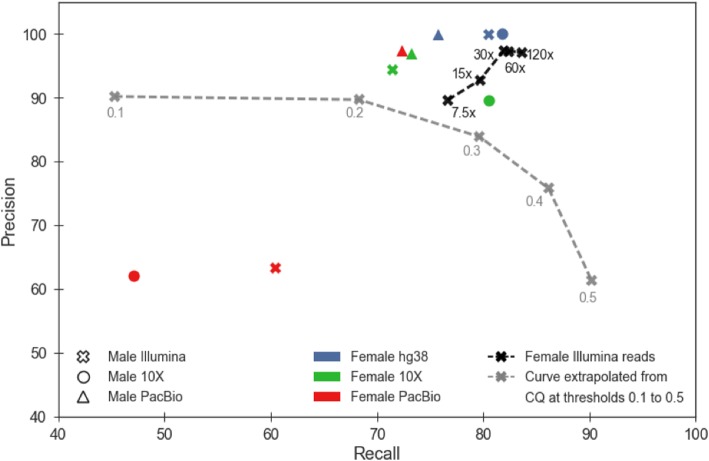
Fig. 1.
Precision and recall of DiscoverY on human data. Each marker represents the result of a DiscoverY experiment. The shape of the marker represents the male assembly used, and color of each marker represents the female reference used. The black, x-shaped markers connected by a dashed line show the performance of DiscoverY with female raw reads (instead of a female reference) at various levels of autosomal coverage. The CQ method is shown as a grey curve extrapolated from running CQ with thresholds 0.1 to 0.5 (in increments of 0.1)

