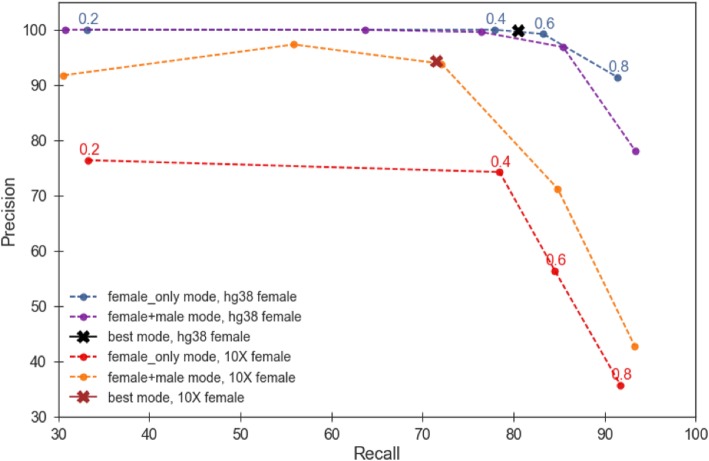
Fig. 4.
Effect of parameter settings on DiscoverY and comparison to YGS. DiscoverY was run across a broad range of parameter settings. Each curve reflects a combination of a given female reference genome (10X or hg38) and a mode (female+male or female_only); two points mark the results of best mode. The YGS method corresponds to the female_only mode. For the male, the Illumina dataset was used. The raw results, across the various parameters, are given in Additional file 1: Table S4; in this figure, the curve shows the upper perimeter of the convex hull of all the parameter settings (i.e. only those runs that produce the highest accuracy). These high-accuracy runs are identified as solid circles on the curve. In the case of female_only mode, the solid circles are labeled with the corresponding female proportion threshold

